Alerts
Seq can keep track of metrics that are important to you, and send a notification if values fall outside of the expected range.
Configuring a Notification App Instance
When an alert condition is detected, you may wish to be notified by email, through a team messaging service like Slack, or through your own notification systems.
Seq apps are plug-ins written in C# that send event data from Seq to a variety of external destinations. You can find many Seq apps available on NuGet, or write your own using Visual Studio.
The examples in this documentation use HTML email app.
To send notifications to an app, start an instance of the app configured with the destination for the alerts.
Adding and Editing Alerts
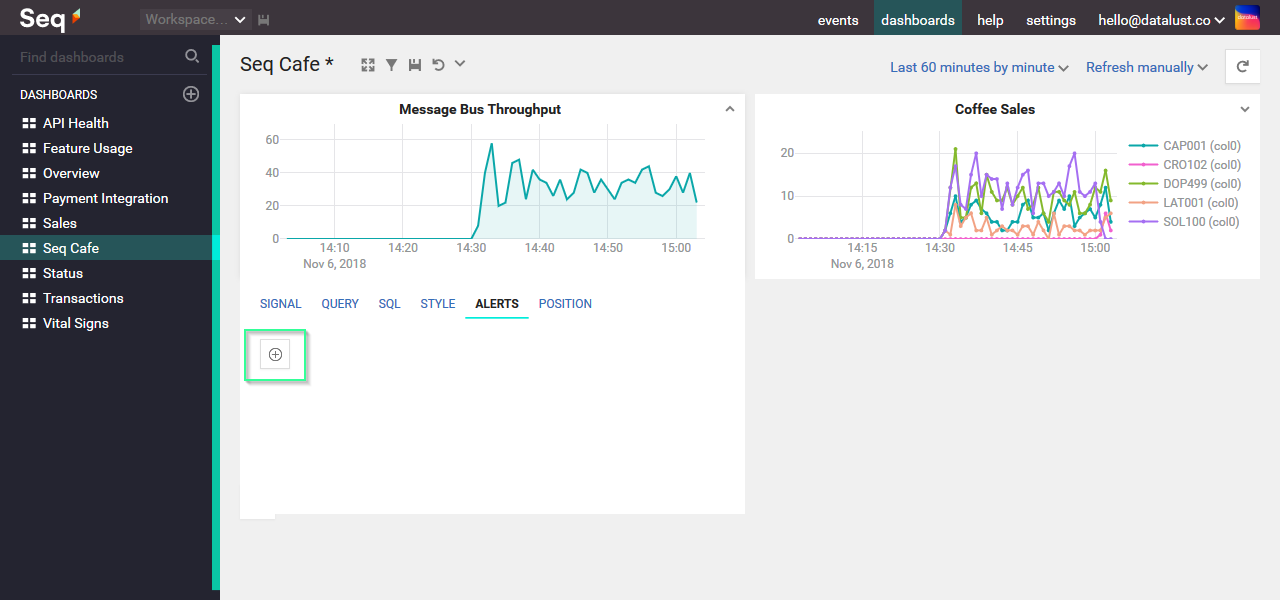
To add an alert, click the + button under the Alerts tab on a dashboard chart:

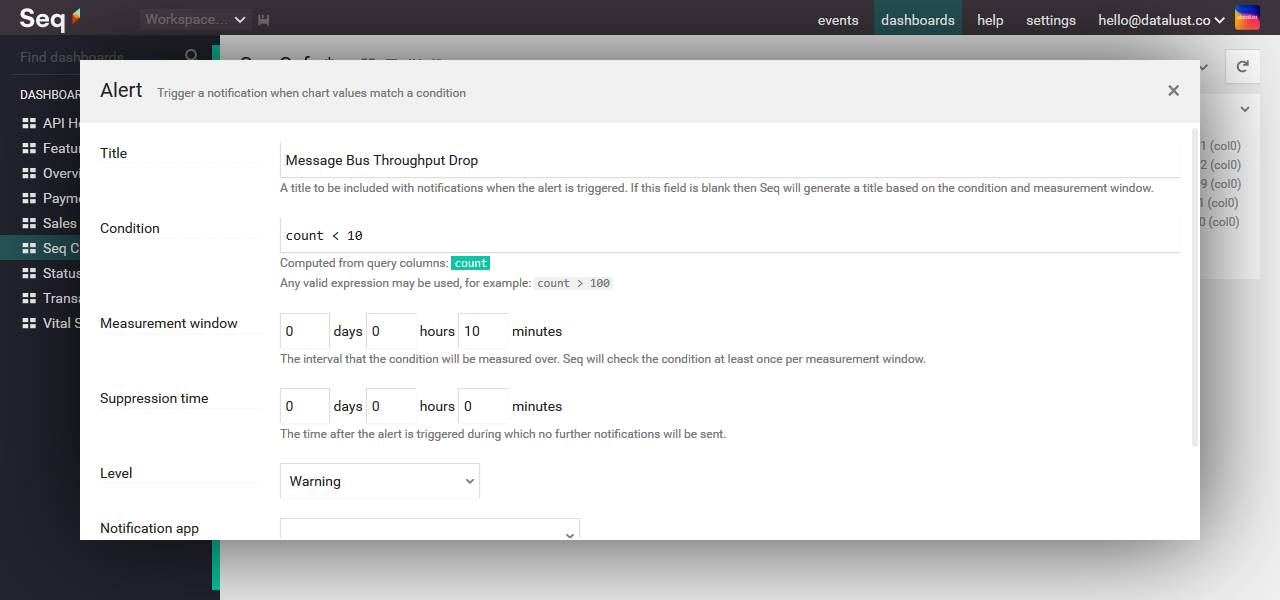
This will present the alert details screen:

Condition
The alert condition is what Seq will periodically check for. This is a SQL expression based on the data that appears on the chart.
For example, if the chart selects a column called count, then the alert condition can use the count column name.
If the query on the chart is grouped, the condition will be evaluated against each individual group and the alert will trigger if any group matches the condition.
In the example above, a notification will be sent if the count column value falls below 5.
Measurement Window
The condition is evaluated over all events in a specific time slice. For example, the alert above will trigger if the count falls below 5 in a one hour window.
Sliding or Jumping Windows?
Seq will check the alert condition more frequently than the measurement window size so that alerts can be triggered in a timely manner. This means that multiple overlapping windows are tested.
For example, an alert with a one-hour measurement window may be tested at 1:05 AM, 1:25 AM and 1:45 AM, each time evaluating the condition over the preceding hour.
Seq also applies a short stabilization window of 30 seconds to give events time to arrive at the server before a specific time window is examined. Events arriving later than this may be excluded from alerting.
Suppression Time
Once an alert has been triggered and a notification sent, Seq can suppress further notifications for a period of time so that an email or pager flood can be avoided.
Keep in mind that following a Seq server re-start, any suppressed alerts will be re-sent.
Level
An alert can be given a level to indicate its importance.
Notification App
The destination for alerts can be chosen from among the available app instances here. Any settings on the app instance that allow overrides can be configured after selecting an app instance.
After creating or editing an app, the dashboard needs to be saved before the changes will become active.
Interpreting Notifications
Seq will send an event with a host of information attached when an alert is triggered.
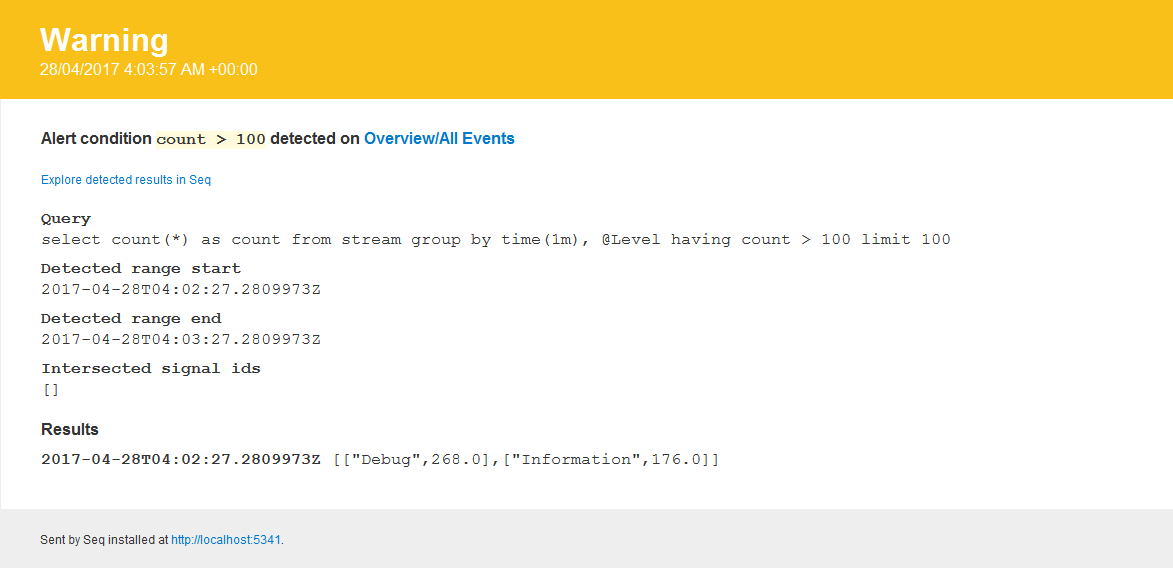
The Seq.App.EmailPlus app shows most of this information in a formatted HTML email:

The banner at the top of the email shows the alert's level, and the time at which the alert was detected.
In the summary line, the dashboard and chart name are hyperlinked, so that the full chart can be viewed.
Because the measurement window "slides", the time slices on the dashboard will not line up precisely with the time slices that generated an alert.
The Explore detected results in Seq link will open the time range in question as an SQL query, showing precisely the values that triggered the alert. From here, the query can be modified to drill down into the data set or view the individual events contributing to the alert.
Other fields shown by the default email template are:
- Query - the SQL query, including a
havingclause with the alert condition, that generated the data. - Detected range - this is the UTC time range over which the query was run in order to generate the alert results.
- Intersected signal ids - shows whether any signals were used to filter the data for the alert; clicking through the "explore" link will show the signals themselves.
- Results - a summary of the result set that the alert generated.
Alerts and User View Filters
When an alert is created by a user with a view filter active, the alert results will be based on only the events visible to that user. Keep in mind that, when other users view the result set through the Seq interface, their view filter (or no view filter) will apply, causing potentially different results to be shown.
Visualising alerts
Alert thresholds are shown as a pink shaded region on a time series chart:

Alert thresholds are only rendered if:
- The condition is a simple
<,<=,>or>=comparison with a numeric value - The numeric value isn't too much greater than the max value on the chart
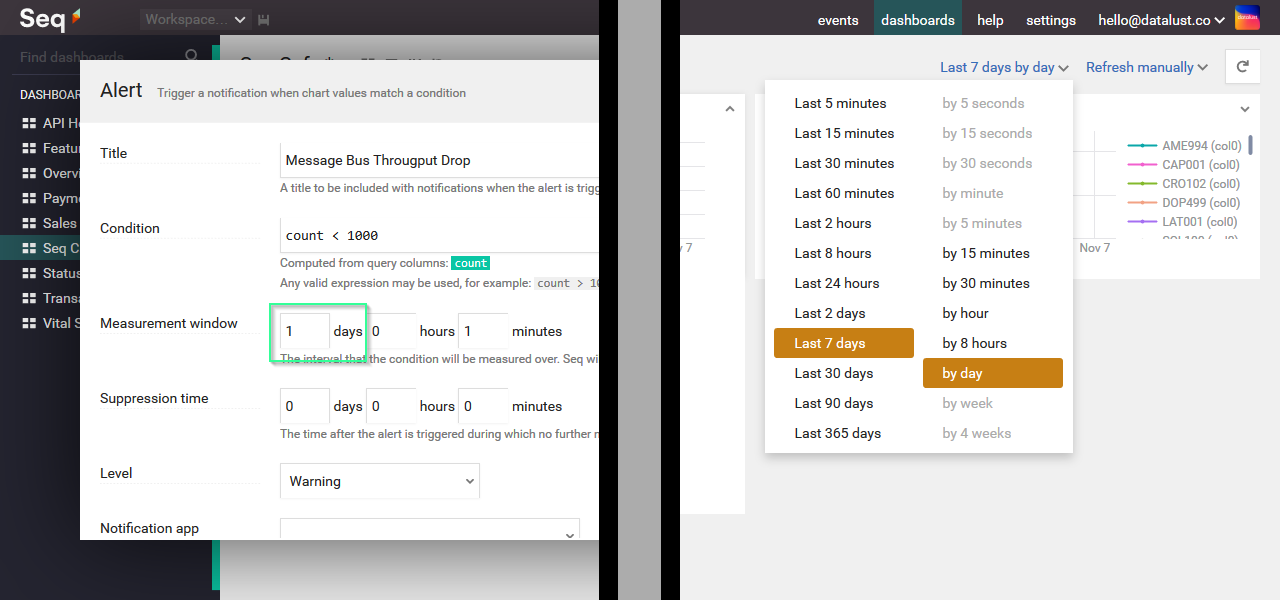
- The dashboard's current time series window is the same as the chart's measurement window
For example, an alert with a condition of count < 1000 and a measurement window of 1 day will be rendered if the dashboard is set to slice by day:

Updated 5 months ago
