Cluster Monitoring and Diagnostics
Seq clusters are designed for low maintenance. For the most part, Seq clusters should just work, with little intervention required. Clusters provide active notifications for potentially serious problems, and record detailed data to the cluster diagnostic instance for performance analysis and troubleshooting.
Data Age Notifications
Seq clusters replicate data between nodes asynchronously. This reduces resource requirements for the cluster, optimizes for capturing live data, and allows the cluster to continue operating with less than a majority of nodes online (thanks to the consistency guarantees provided by the cluster state database).
Data age is defined as the age of the most recent data replicated to a node. The leader node, responsible for ingestion, will always have a data age of zero. A node that has replicated all data received by the leader until 200 ms ago has a data age of 200 ms. Data age is also called "replication lag" or "replication delay".
Seq internally monitors data age, and generates system notifications when the number of nodes with a data age within the configured threshold drops below the cluster's target replica count. See Finalizing Cluster Configuration for instructions for configuring notifications, if this has not already been done.
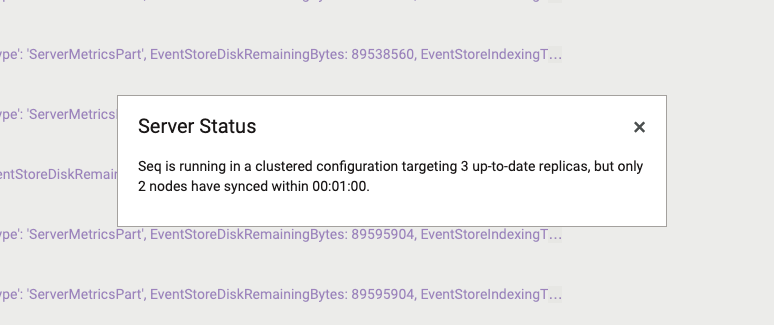
If your Seq server produces data age warnings like the one above, the risk of data loss is increased, and the problem should be investigated promptly.
The first place to look for problem details is the Data > Cluster page. If a node is shown as out-of-date, or missing, check the state of the node's host, Seq Windows Service, or Docker container.
In the cluster diagnostic instance, querying the event stream with @Resource.seq.node.name = 'node01.seq.local' (substituting for the problem node name) will surface recent diagnostics from that node.
Diagnostic Instance Templates
Datalust maintains a set of signals and dashboards for the Cluster Diagnostic Instance in this GitHub repository .
To apply these to the diagnostic instance, assuming git and seqcli are on the path:
git clone https://github.com/datalust/cluster-diagnostic-templates
cd cluster-diagnostic-templates
seqcli template import --merge -s $DIAGNOSTIC_INSTANCE_URI -a $API_KEY
The import will create an import.state file in the current directory - keep this around to improve the accuracy of future updates.
Note that once the import completes you'll need to deselect the "Personal" workspace to see all of the available signals and dashboards.
Updating
When new Seq releases are installed on the cluster, the diagnostic templates can be updated with:
git pull
seqcli template import -s $DIAGNOSTIC_INSTANCE_URI -a $API_KEY
Key Metrics
The diagnostic instance templates include dashboards for many sets of metrics reported by the running cluster:
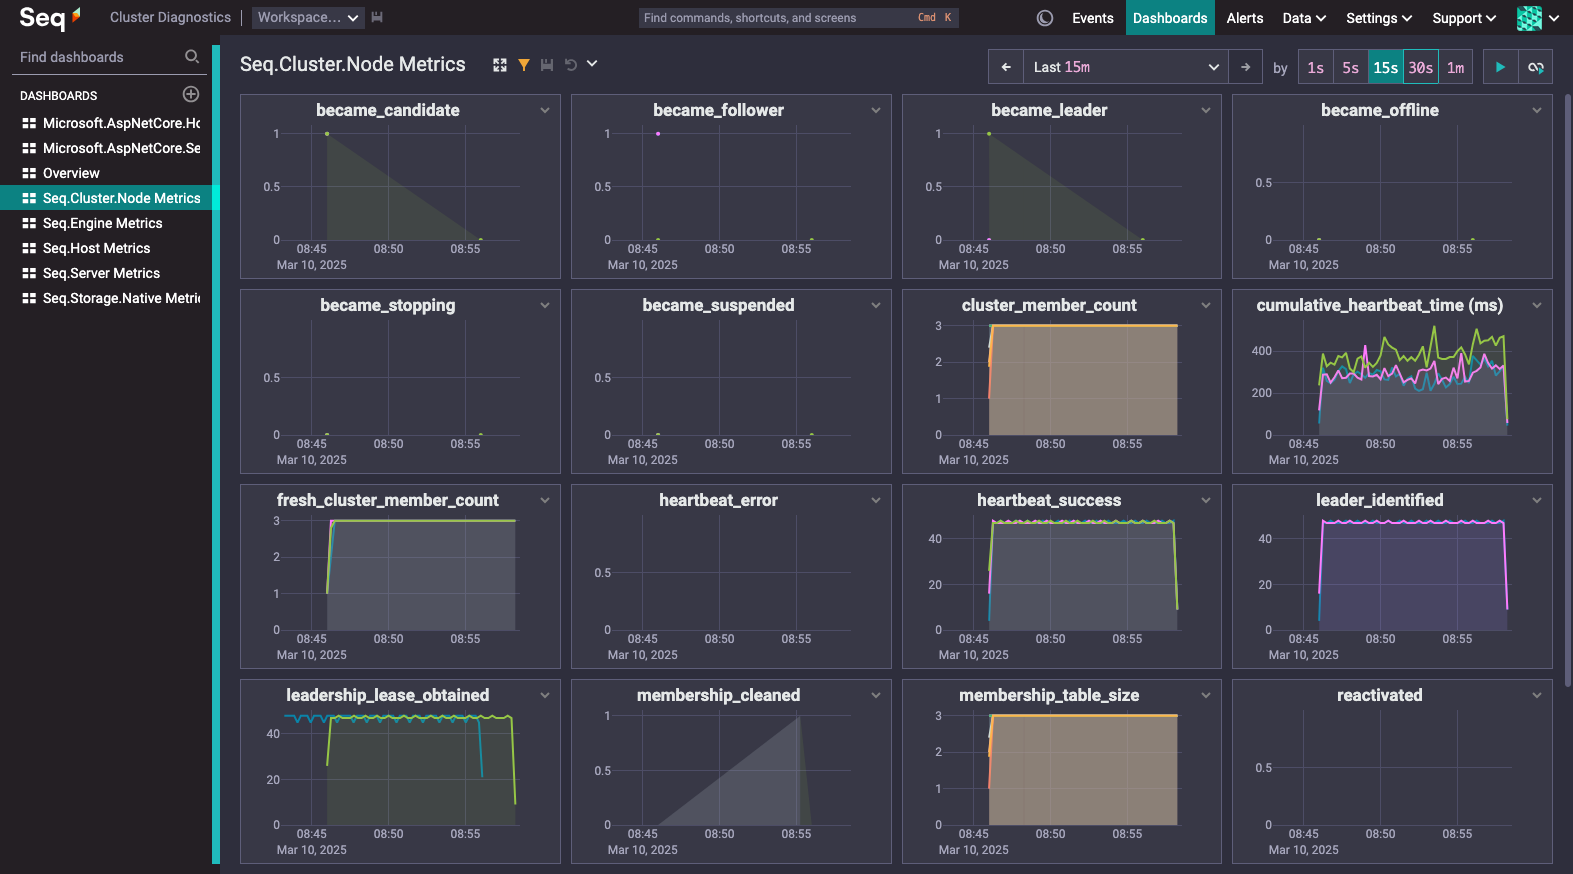
Some key metrics to watch:
http.server.active_requests(Microsoft.AspNetCore.Hosting) - shows, per node, the number of HTTP requests being processed, including ingestion and intra-cluster API traffic. Requests queued at the load balancer, or in the node host operating system's TCP stack, are not counted.became_leader(Seq.Cluster.Node Metrics) - reported by a Seq node when it becomes cluster leader. Nonzero samples after cluster start-up are expected to be rare.cumulative_heartbeat_time(Seq.Cluster.Node Metrics) - the total time, within the measurement interval, that the node spent updating its state in the shared cluster state database. Spikes/increasing values indicate problems with the cluster state database or network conditions between it and the cluster nodes.replicated_data_age(Seq.Cluster.Node Metrics) - shows the cluster-wide data age over time. This value is reported only by the current cluster leader.data_store_queries(Seq.Engine Metrics) - the number of queries being processed by the cluster.write_time(Seq.Engine Metrics) - the total time, within the measurement interval, spent writing ingested data to storage. If write time regularly exceeds 10% of the measurement interval duration, write capacity on the leader node is likely to be a performance bottleneck.process_cpu_current(Seq.Host Metrics) - per node, the percentage of CPU time consumed by the Seq process.net_bytes_sentandnet_bytes_received(Seq.Storage.Native Metrics) - network traffic generated by the cluster network (data replication and distributed query execution).
Detailed Query Tracing
To examine query execution behavior on the cluster, first enable detailed query tracing in your user preferences (on the cluster itself, not in the diagnostic instance):
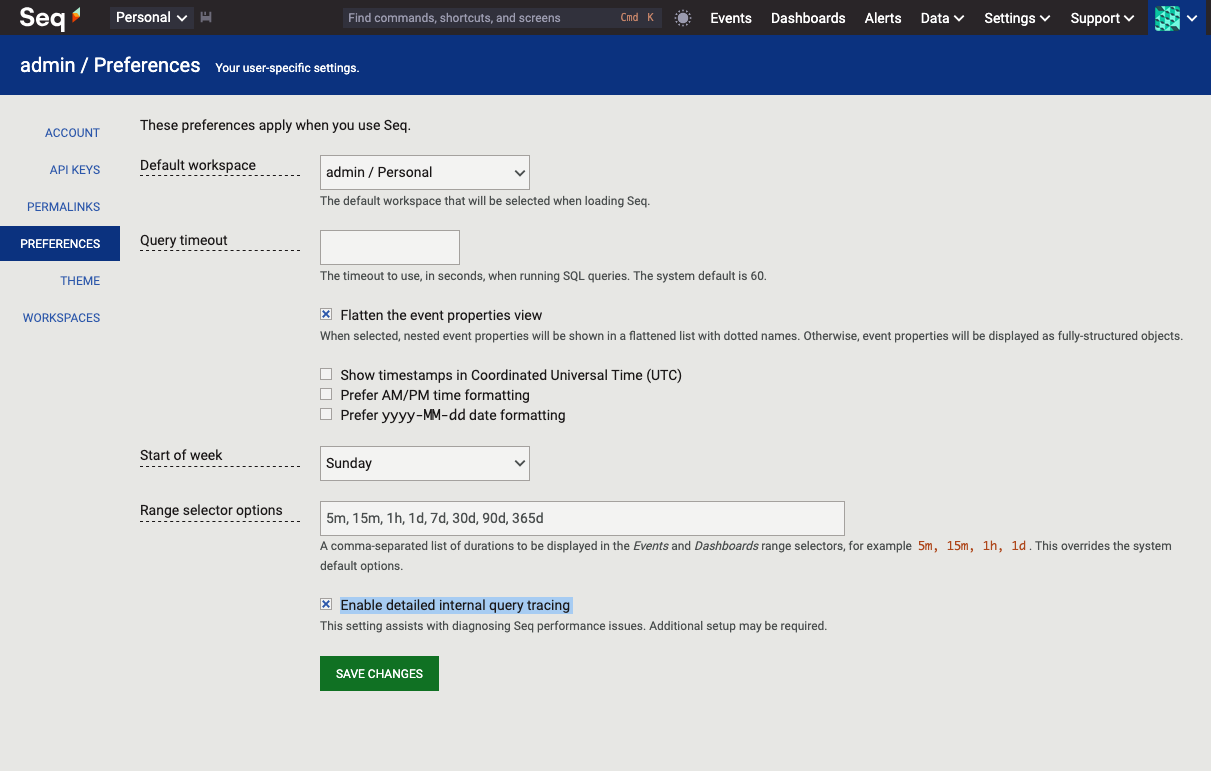
Next, run a query on the cluster.
In the diagnostic instance, select the "Spans" and "Columns" signals, and find a span containing the query text. Click the timing bar next to the span to view the query trace.
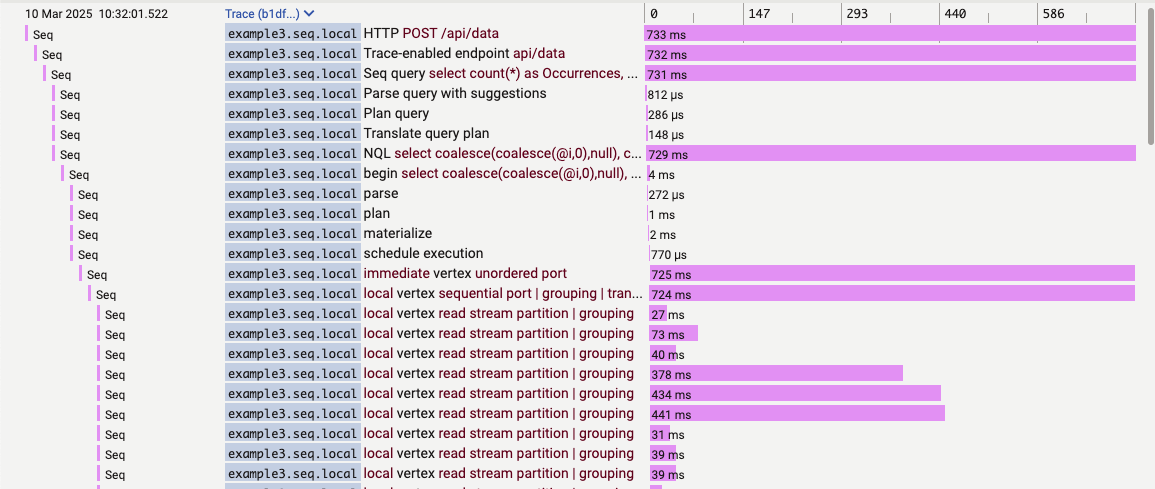
The "Columns" signal causes the node name to appear as a column beside each span. Unless the system is busy, queries generally begin execution on the leader ("immediate" and "local" vertexes) because of the network latency between nodes. If your query was computation-intensive, scrolling down will show some remote nodes participating in the query:
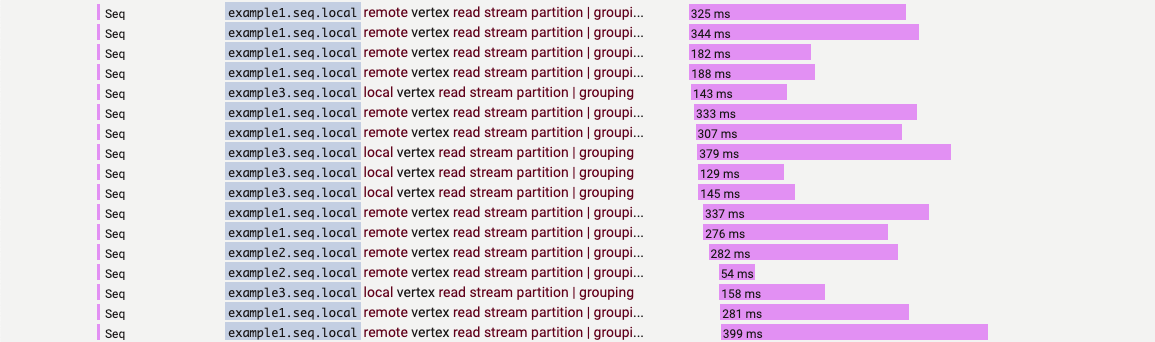
Spans in the trace can be examined, or @Elapsed grouped by @Resource.seq.node.name for the "vertex" event type, to analyze performance across the cluster.
Updated 4 months ago