Managing Storage
Making sense of how Seq stores event data on disk
Data > Storage gives you an idea of how effectively retention policies are reclaiming disk space. It includes a chart that shows how much space is being used now by events ingested in the past. It doesn’t track disk usage over time, which should remain fairly constant on a healthy server.

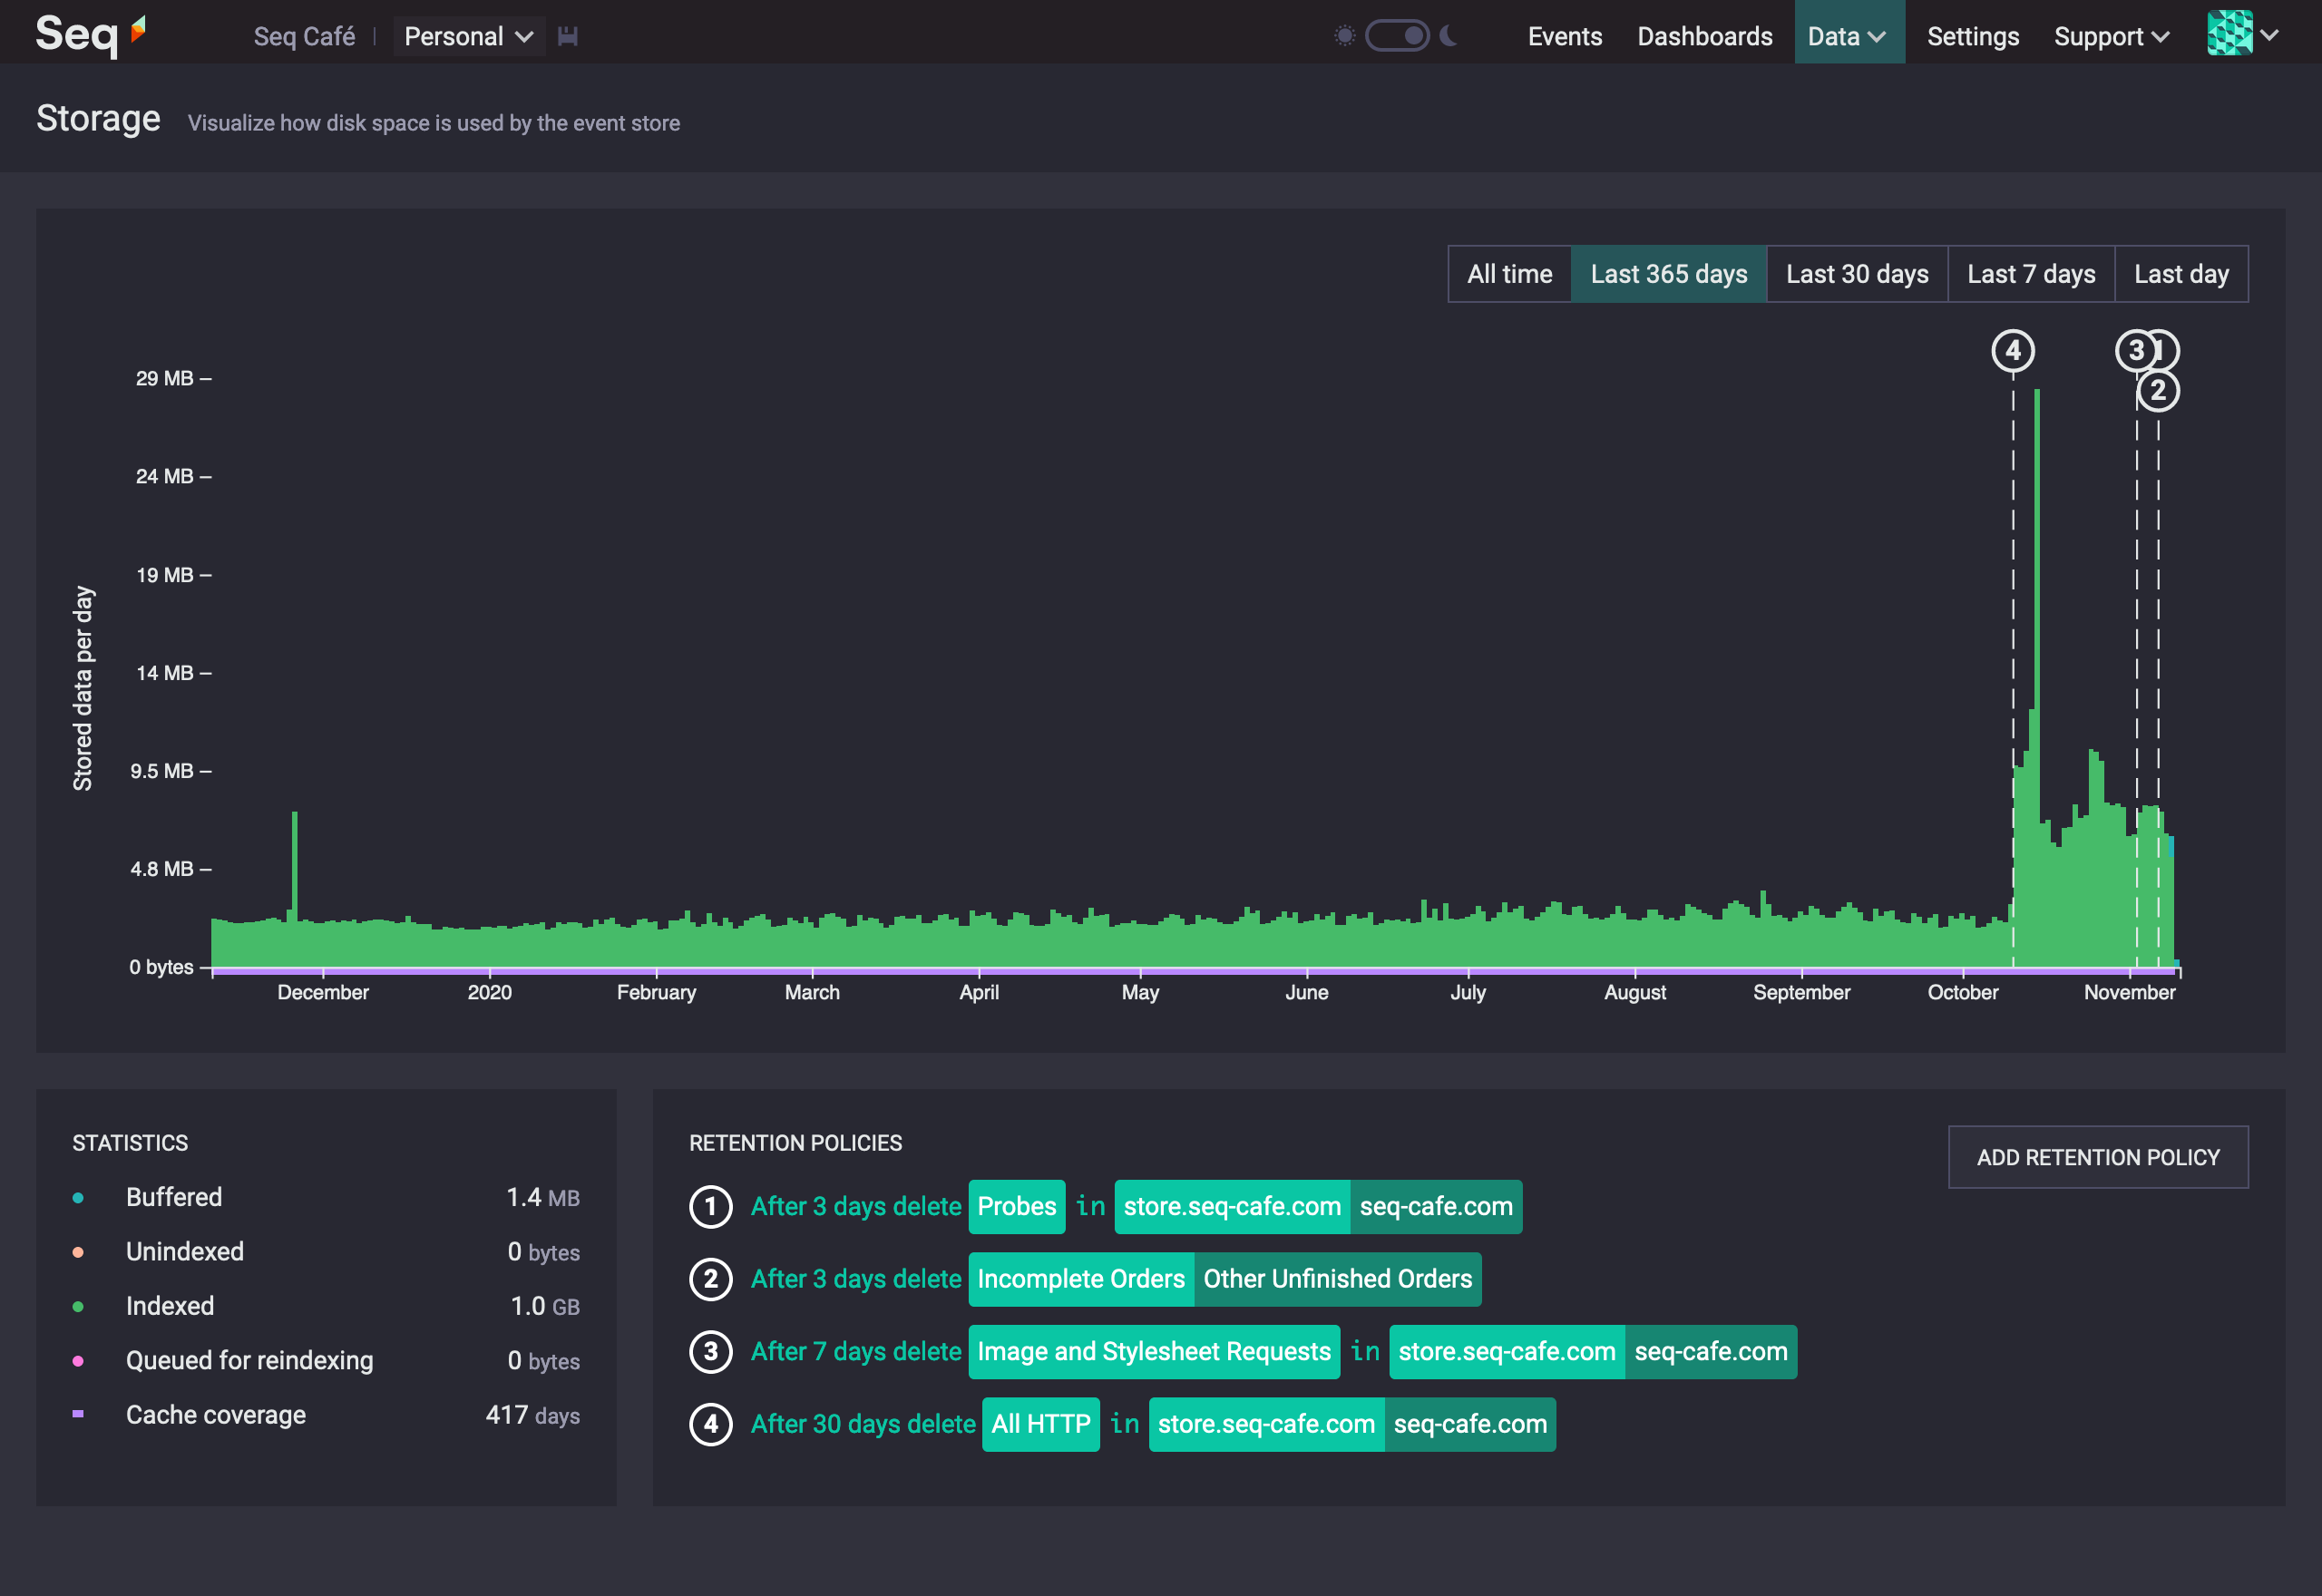
The storage view chart showing indexed data for the last 365 days along with retention policies.
Interacting with the chart
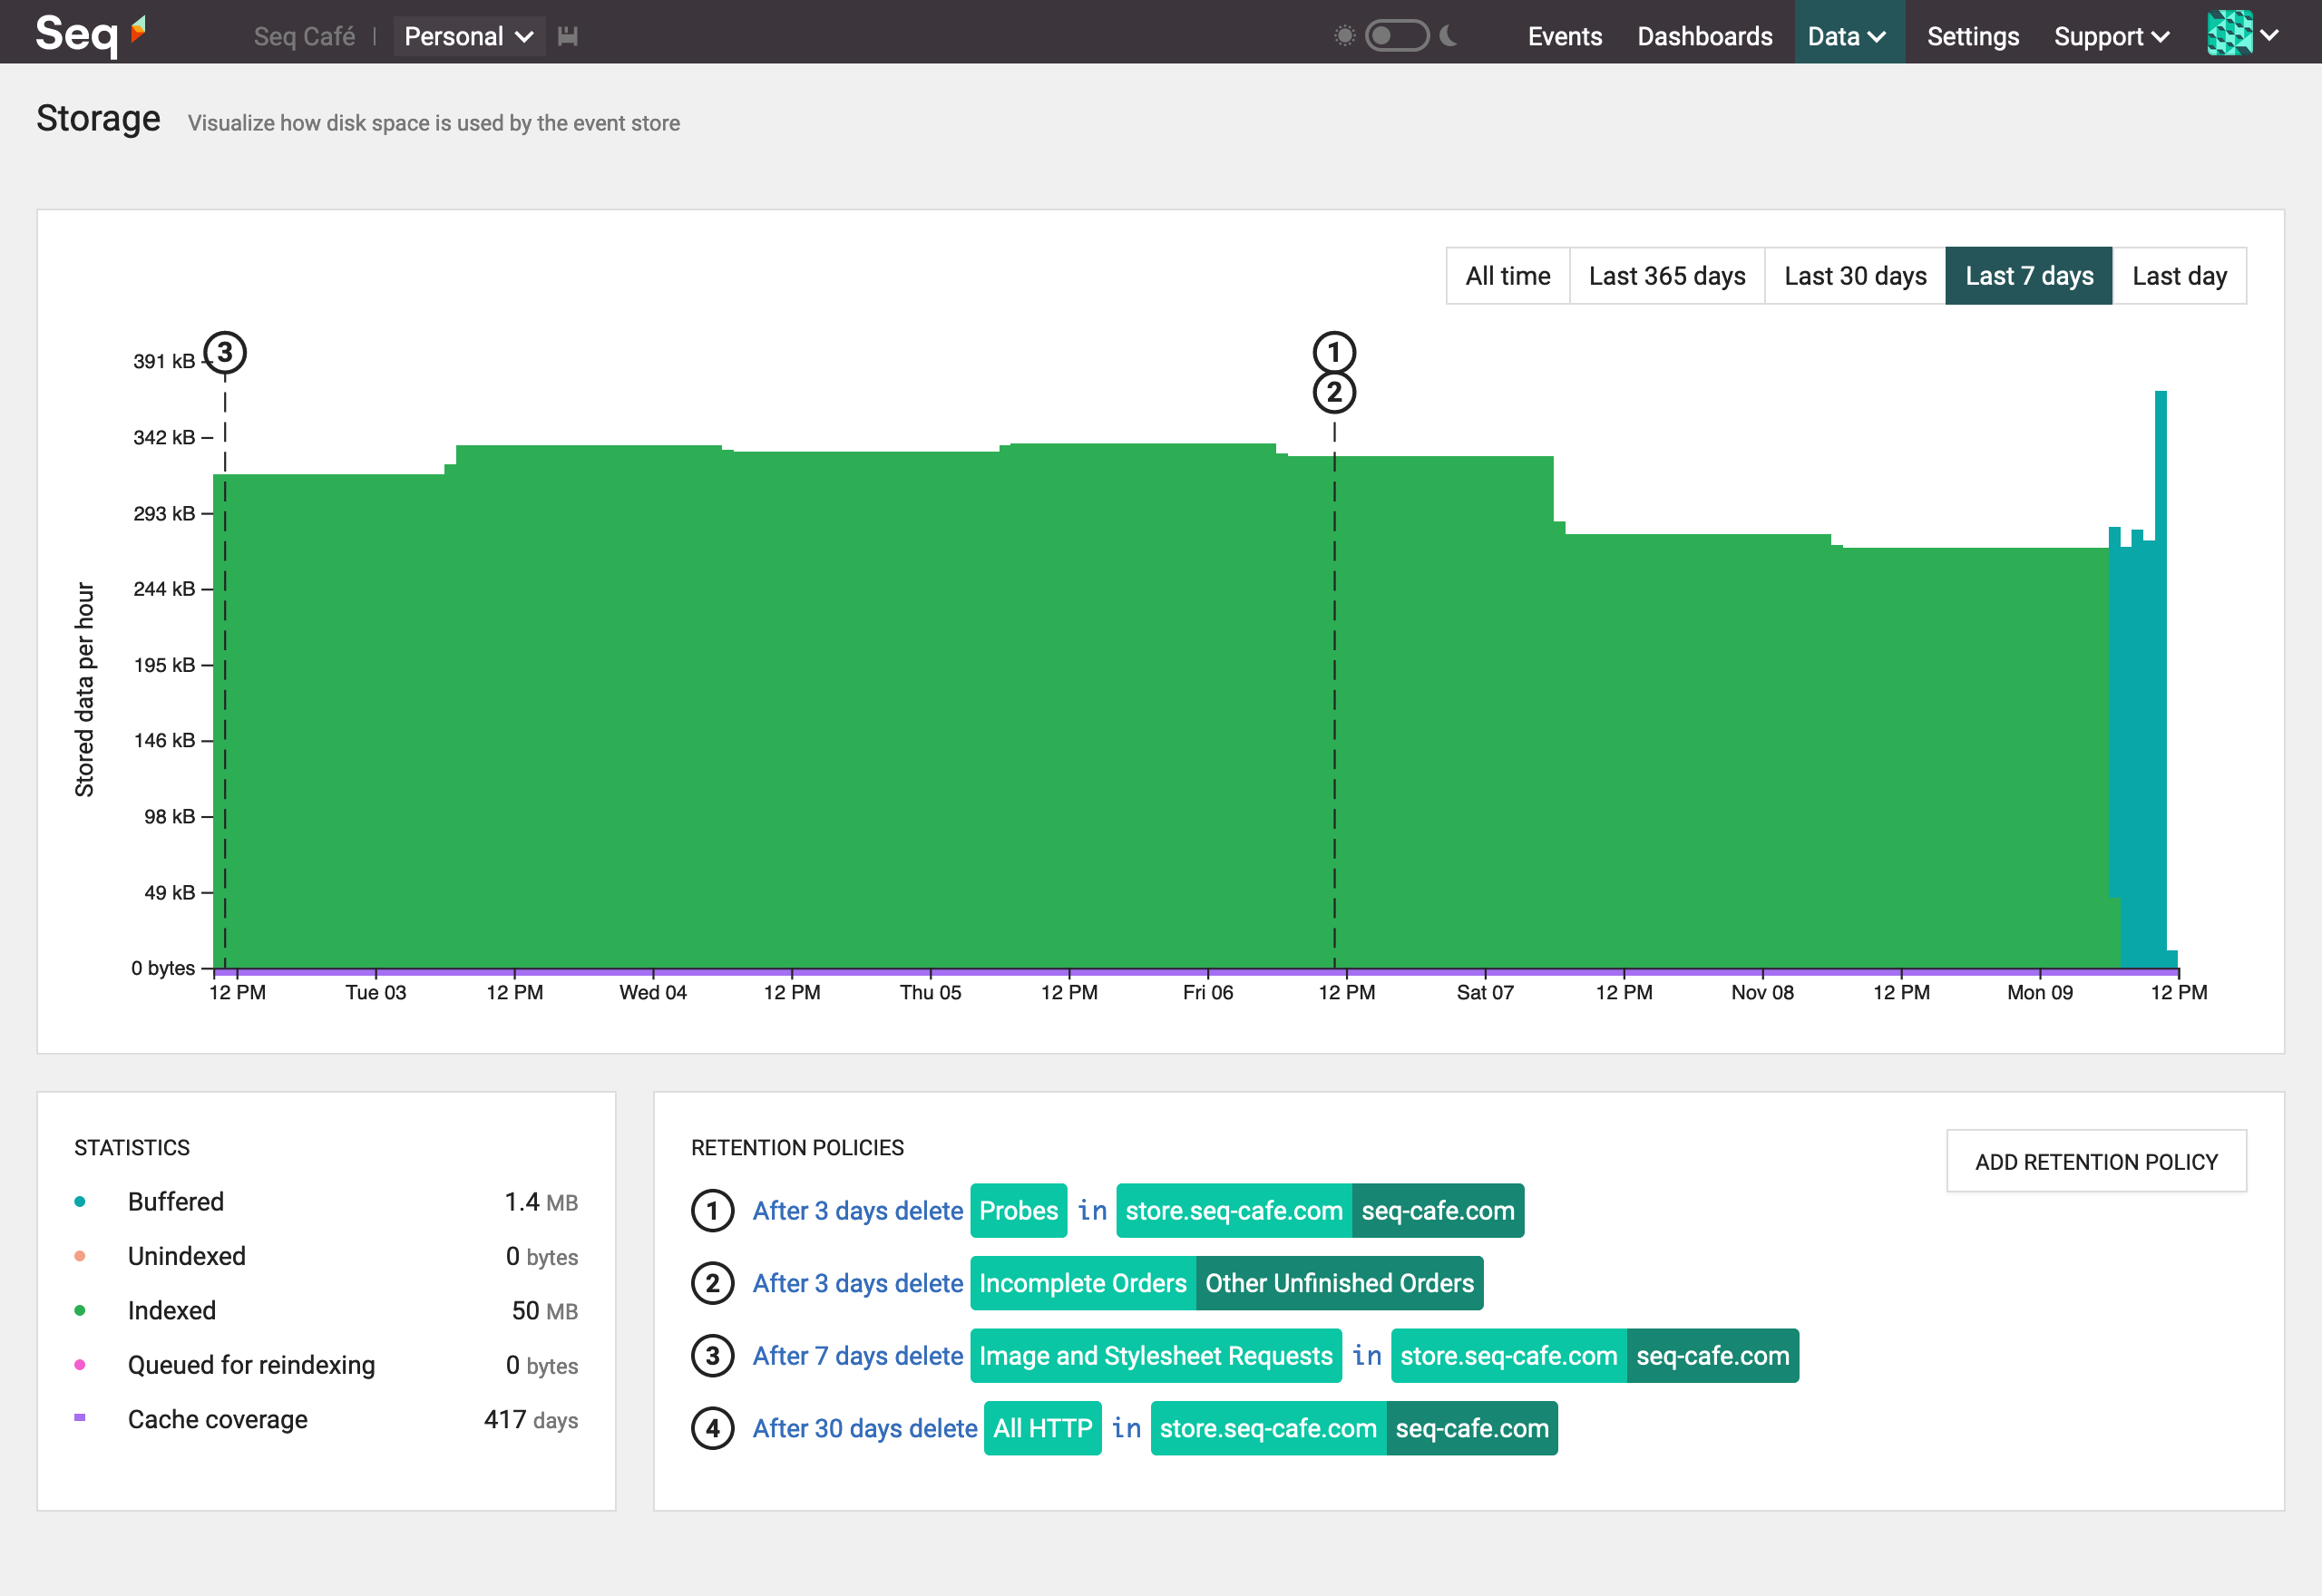
The storage chart defaults to showing all data by day. You can change the time range to view more recent data in greater detail.

The storage view chart showing indexed and buffered data for the last 7 days.
Interpreting the chart
Statistics
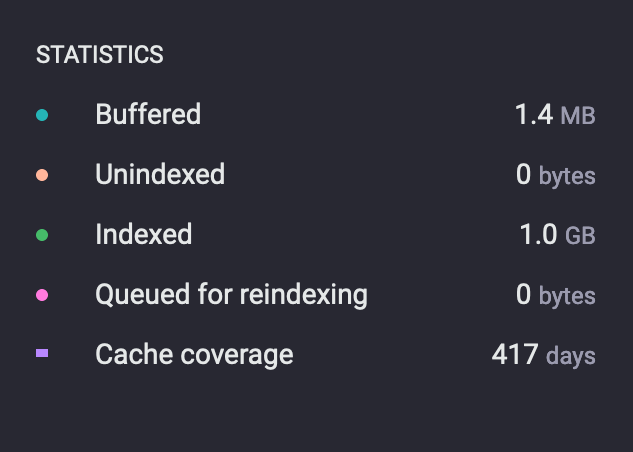
The Storage View visualizes event data that may be stored on disk in one of a number of states.

Storage view statistics indicating 1.4 MB of buffered data, 1 GB of indexed data, and a cache coverage of 417 days.
- Cache coverage: Represented as a purple bar along the bottom of the chart. Shows the range of events in RAM. Queries within this range don’t need to touch the disk.
- Buffered: Represented as a blue shaded area on the chart. Just ingested and out of order.
- Indexed: Represented as a green shaded area on the chart. Coalesced and indexed. This is the state most of the stream should be in, especially areas outside of the cache.
- Unindexed: Represented as a yellow shaded area on the chart. Coalesced but not yet indexed. This happens approximately every 10 minutes.
- Queued for reindexing: Represented as a pink shaded area on the chart. Coalesced but indexes are out of date. These are updated approximately every 10 minutes with unindexed data. This happens to all data when signals are created or modified.
Are retention policies reclaiming space?
If retention policies are effective you should notice a drop in the area under the chart at the point where the policy is applied.
If retention policies don’t seem to be effective then you can look at the shape of retained data and see if there’s a different filter that would remove more data as it becomes unnecessary.
Is my cache covering enough data?
The purple bar along the bottom of the chart indicates the range of events in cache. At the very least this line should cover all buffered data. If it doesn’t then the machine will be working extra hard to sort buffered data before serving queries.
If the cache doesn’t cover buffered data then you can add more RAM to your Seq instance or try reduce the amount of ingested data with ingestion filters or by investigating applications that are producing large events.
Are indexes being churned?
When a signal is created or updated the green indexed portions of the chart will become pink, indicating that there’s reindexing work to do. This is done after retention policies are processed approximately every 10 minutes. This doesn’t necessarily indicate a problem, but if the chart appears to spend more time pink than green then there could be a lot of IO spent on reindexing.
Updated 5 months ago
