Performance Troubleshooting
Troubleshoot Seq server performance and responsiveness
If Seq query performance is lagging, this page will help you track down the issue or collect the information our Support Team will need to help you out.
Investigating Performance Problems
Use of signals for searches and queries
Selecting signals to narrow the search space can dramatically improve responsiveness by reducing CPU requirements and disk I/O. Each signal corresponds to an index of matching events, so queries and searches need to process less data. Signals can be combined to further reduce the search space. For example, selecting an Errors signal and a signal for a particular application will only search those parts of the log that contain both errors and events for the selected application.
To maintain efficient operation, it's important to use signals when working in the Events screen, and to use signals rather than where conditions on dashboard charts and alerts wherever possible.
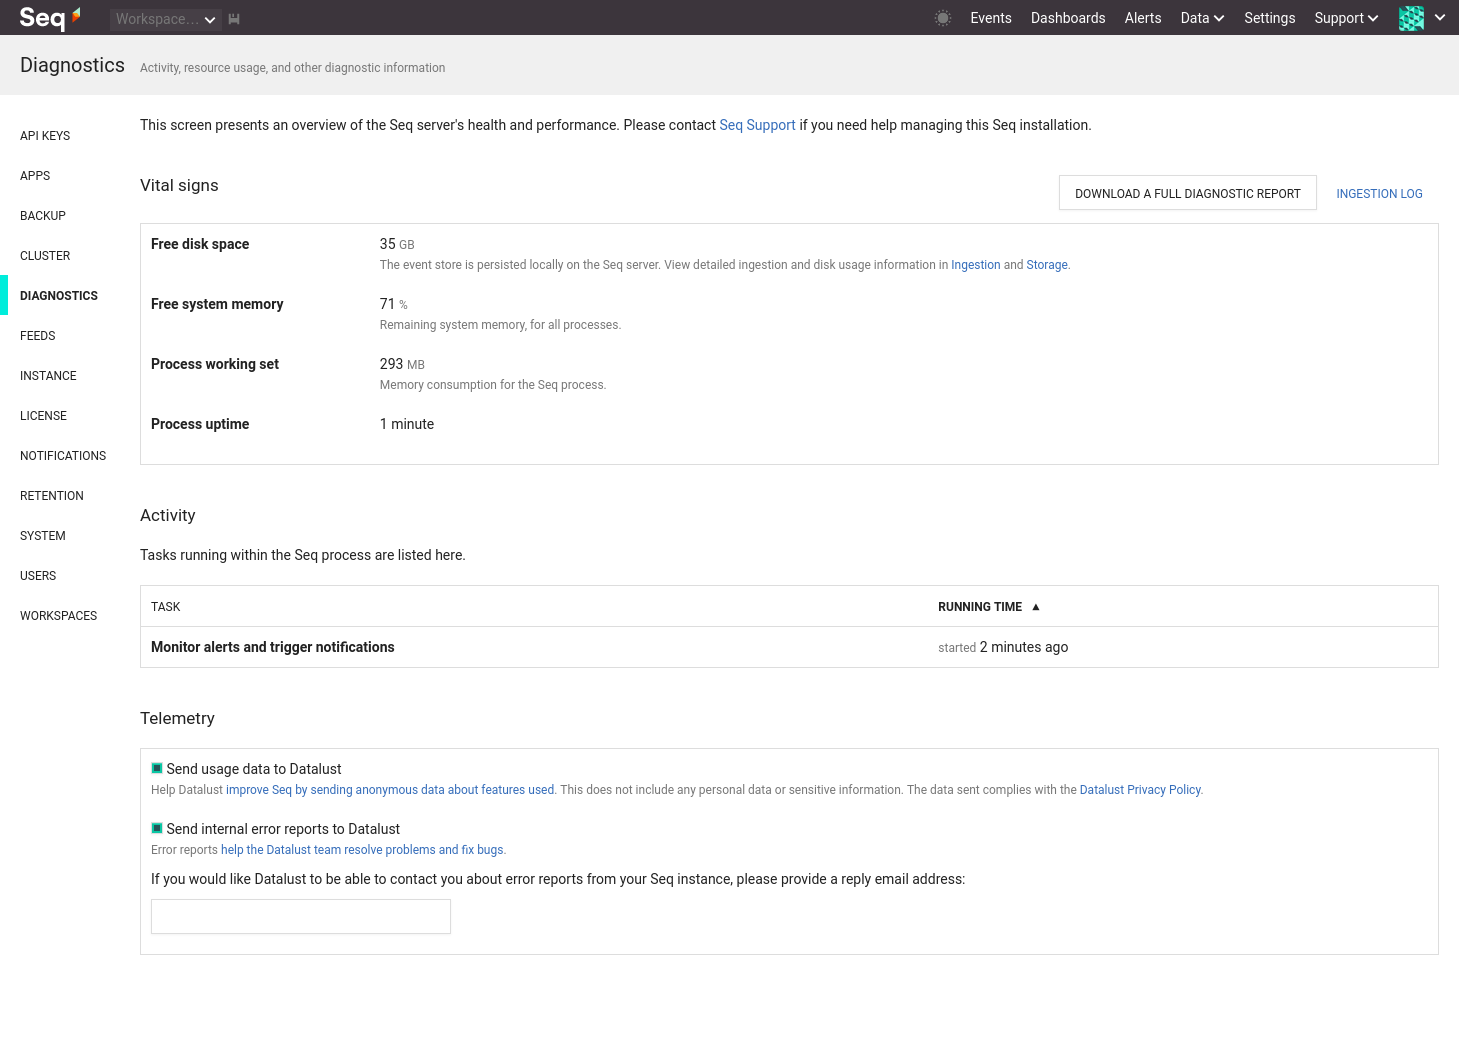
Inefficient queries and searches can often be tracked down using the Activities list under Settings > Diagnostics.
System Requirements
Increasing system memory, available CPUs and IO bandwidth all contribute to Seq's performance. Check the System Requirements documentation for some rule-of-thumb pointers to appropriate hardware sizing.
We highly recommend provisioning SSD storage for production Seq servers expected to handle any significant load.
Telemetry data is messy, complex, and voluminous. Giving your log server a little extra CPU, RAM and I/O capacity can help it dig through events more effectively.
Ingestion Rate
The best place to go to diagnose ingestion issues is the Ingestion View. It shows ingestion rates over the last 24 hours so that spikes and other anomalies can be spotted. The various ingestion-related counters show the number of events arriving at Seq. If this number is unexpectedly high, you might have a runaway process logging more data than intended.
Seq also exposes various metrics through the Settings > Diagnostics page in Seq itself.

This page includes information about the Seq process and the machine it is running on.
The best way to control ingestion in Seq is through API keys; they can not only provide fine-grained information about where events are coming from, but can also be used to apply levels and filters independently to the log sources sending data to Seq.
Retention Policies
The ideal retention policy configuration removes bulky data early to increase the range of cached events.
A typical retention scheme may look something like:
- On ingestion, remove debug-level events by setting a level on the appropriate API key (or configuring the source application not to log debug-level events)
- At 7 days, remove tracing information, for example, logged HTTP requests/paths/status codes
- At 30 days, remove all information that's not used in long-term tracking (i.e. doesn't contribute to charts/reports that will be viewed over a long time period)
You can get a picture of how effectively retention policies are reclaiming space using the Storage View, which should indicate a drop in disk space used by historical data.
Each retention policy requires some CPU and disk time in order to run. Aim to consolidate requirements into 3-5 retention policies at most, if possible.
The All events policy is the cheapest to run, as Seq can use optimized file operations to remove old data; setting up an All events policy is recommended.
Event Structure
The size and shape of events has a substantial impact on how efficiently Seq can work with them.
- Seq is designed for regular log events - don't serialize large objects into log events that will be recorded in production
- Prefer attaching properties rather than concatenating contextual information into messages
See this article for some more tips on writing structured events effectively.
Getting Help
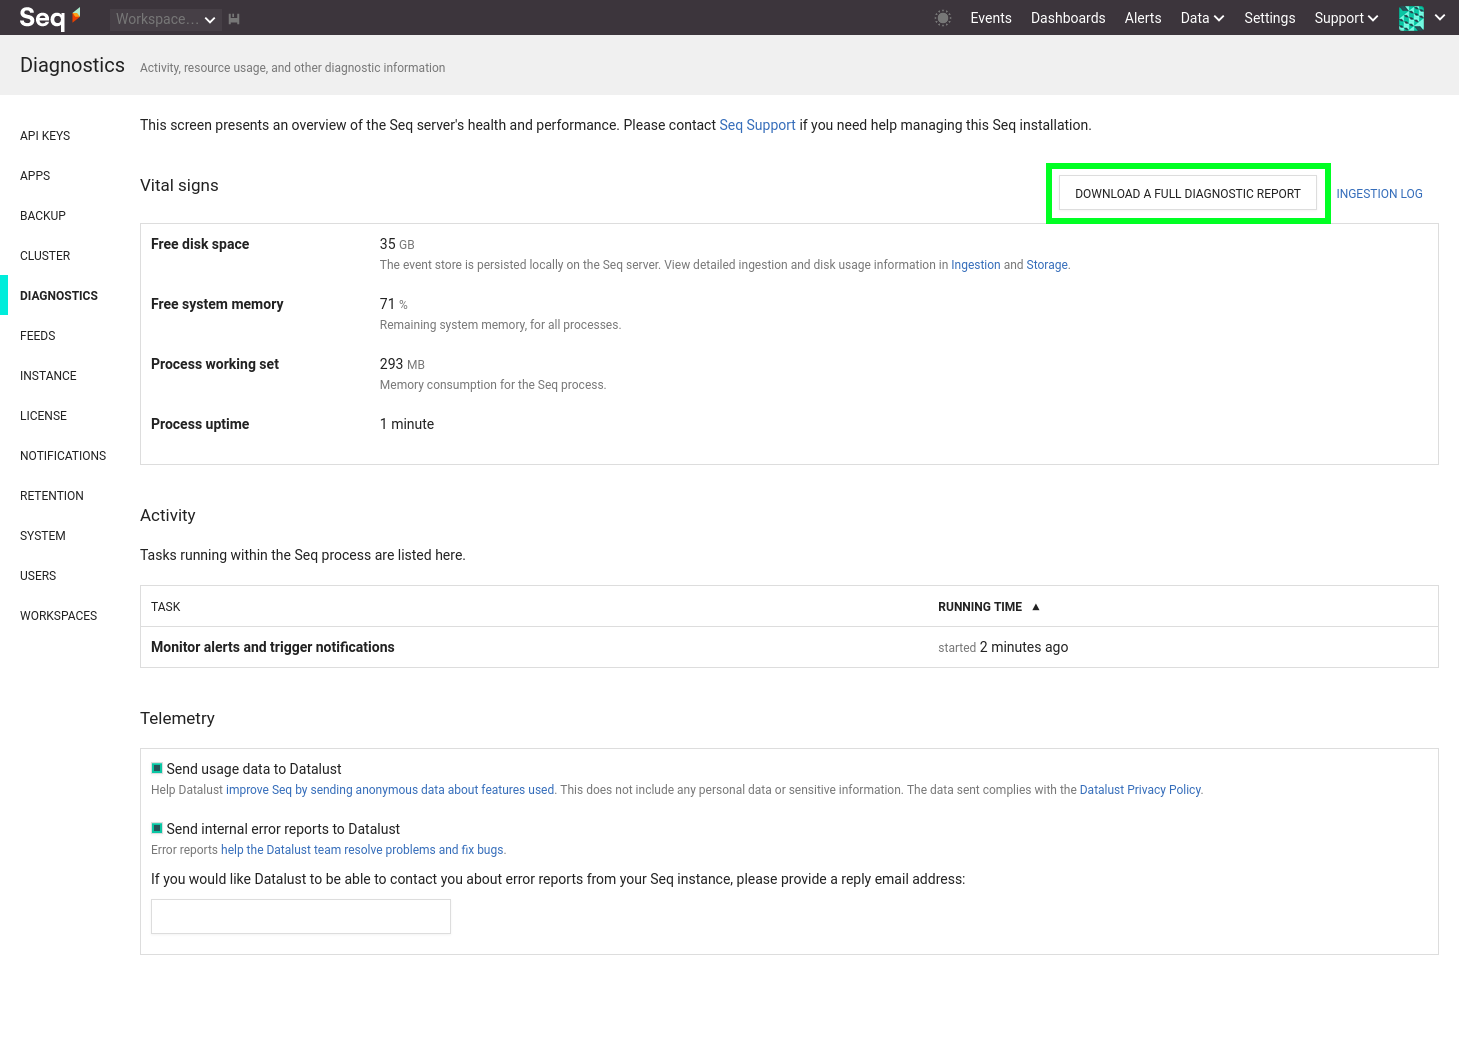
If you need to troubleshoot a performance issue with our Support Team, including the information from the Settings > Diagnostics page will help us help you faster.
You can download this information as a report, including recent internal logs from the Seq server, using the link at the bottom of the diagnostics page:

An email contact is listed in Seq's 'Support' menu.
Updated 5 months ago
