Logging from OpenTelemetry
Seq exposes native OTLP endpoints for log ingestion from OpenTelemetry sources.
OpenTelemetry is a suite of protocols, libraries, and related software built around a single model for diagnostic data. The OpenTelemetry protocol (OTLP) can be used to transfer structured logs from instrumented applications through to receivers like Seq, without the need for log parsing, adapters, or transformers.
Seq implements the OpenTelemetry Logs and Traces protocol natively, providing both gRPC and HTTP endpoints integrated directly into the Seq API. Sending Traces to Seq from OpenTelemetry is documented separately.
This means that if you can reach Seq in a web browser, you already have everything you need to successfully ingest logs from any OpenTelemetry data source.
OTLP endpoints
OpenTelemetry defines three protocol flavors: gRPC, and HTTP with either protobuf or JSON encoding. Seq implements the first two of these; HTTP/JSON is not yet available.
HTTP/protobuf endpoint
The HTTP/protobuf protocol flavor is often a good starting point because it supports HTTP with and without TLS, and does not place any special requirements on other network infrastructure.
Seq's HTTP/protobuf OTLP logs endpoint is
/ingest/otlp/v1/logs.
Configure your OpenTelemetry log source as follows.
| Parameter | Value | Example |
|---|---|---|
| Protocol | http/protobuf | |
| Endpoint | /ingest/otlp/v1/logs on any port served by Seq | https://seq.example.com/ingest/otlp/v1/logs |
| Headers | Send your Seq API key in X-Seq-ApiKey | X-Seq-ApiKey: abcd1234 |
gRPC endpoint
Seq can ingest logs using the gRPC protocol flavor:
- on endpoints served using HTTPS (TLS), and
- where all intermediate network infrastructure fully supports HTTP 2.0.
On Windows, this requires Seq to be hosted under the Kestrel web server.
If you're unsure about any of these conditions, start with the HTTP/protobuf protocol flavor described above.
HTTPS is required
Seq cannot provide gRPC ingestion through unsecured HTTP connections.
To use Seq's gRPC ingestion endpoint, configure your OpenTelemetry log source with:
| Parameter | Value | Example |
|---|---|---|
| Protocol | grpc | |
| Endpoint | The HTTPS root URL identifying your Seq server | https://example.com |
| Headers | Send your Seq API key in X-Seq-ApiKey | X-Seq-ApiKey: abcd1234 |
Trace and span correlation
Events ingested via OTLP that carry trace and span information will show a Trace drop-down menu in event details:
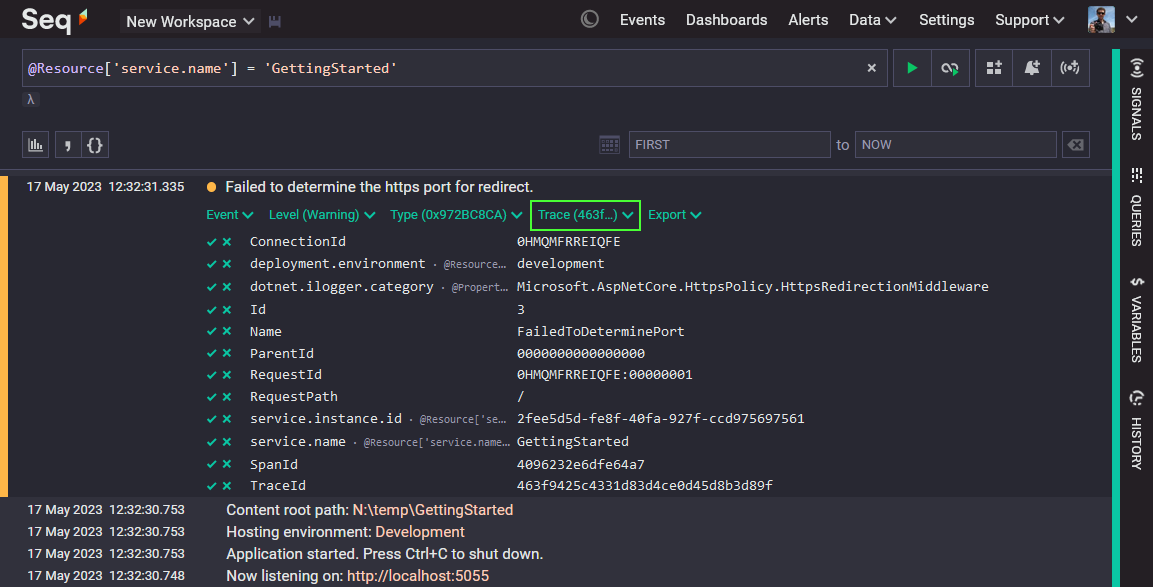
Seq Events screen showing OTLP event with trace menu highlighted.
You can use the Trace menu to find other events in the same trace or span.
Within Seq queries and searches, trace information for an event is available in @TraceId and @SpanId.
Accessing resource attributes
OTLP attributes that are applied to resources are collected into a @Resource object that all events carry. This is separate from @Properties, which contains the properties associated directly with the individual event.
In the event properties list, resource attributes trigger an inlay hint next to the property name that shows the full syntactic name of the property:
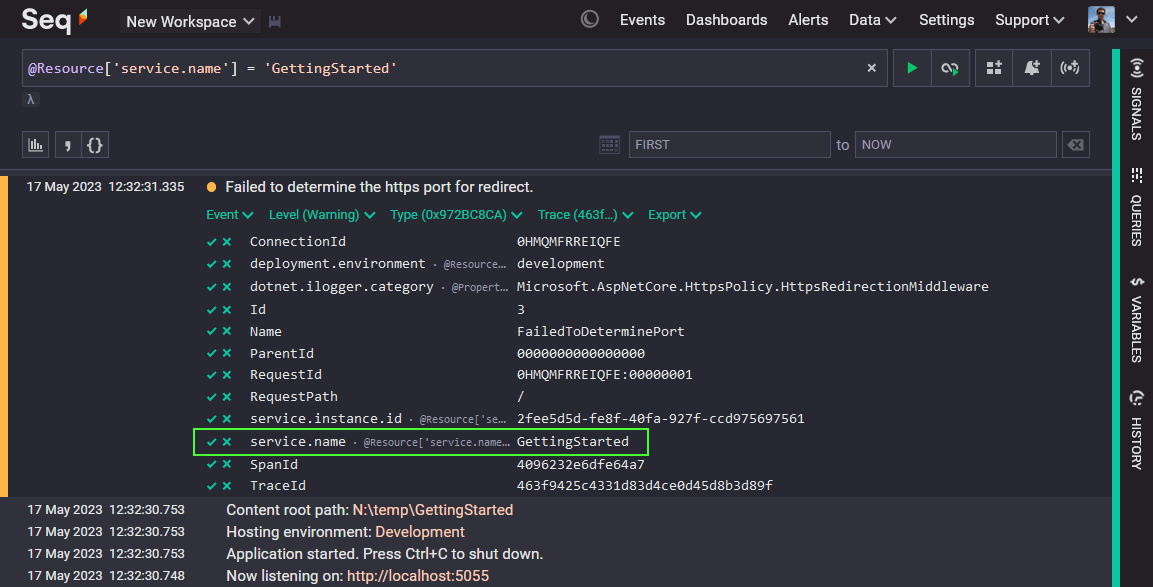
Resource properties can be referenced using indexer notation, for example:
@Resource.service.name = 'GettingStarted'Or, if a resource property uses a simple name that is a valid Seq identifier, dotted accessor syntax is supported:
@Resource.app = 'Demo'Configuring the OpenTelemetry Collector
To export logs to Seq from the OpenTelemetry Collector, first add otlhttp to the exporters node in your collector config:
exporters:
  otlphttp:
    endpoint: https://seq.example.com/ingest/otlp
Note that the endpoint path should not include the /v1/logs suffix, as these are added automatically by the collector.
Next, add the exporter to the service.pipelines.logs node:
service:
  pipelines:
    logs:
      exporters: [otlphttp]
If logs don't start flowing, check the collector container's terminal output.
Updated 5 months ago