Query Syntax
Use queries to aggregate results with operators like count, mean and distinct
Read the primer?
If you're new to Seq's query language, start with Searching and Analyzing Logs and Spans - it's a complete syntax primer for the busy developer.
In addition to simple search expressions, Seq provides a SQL-like query syntax for more advanced queries. Queries in Seq permit:
- Tabular queries -
selectevent properties as columns - Aggregate operators like
count,mean,distinct,percentileandsum - Time groupings to apply an aggregation over individual time slices
Queries enable charting through the view selector that will appear above and to the left of a result set.
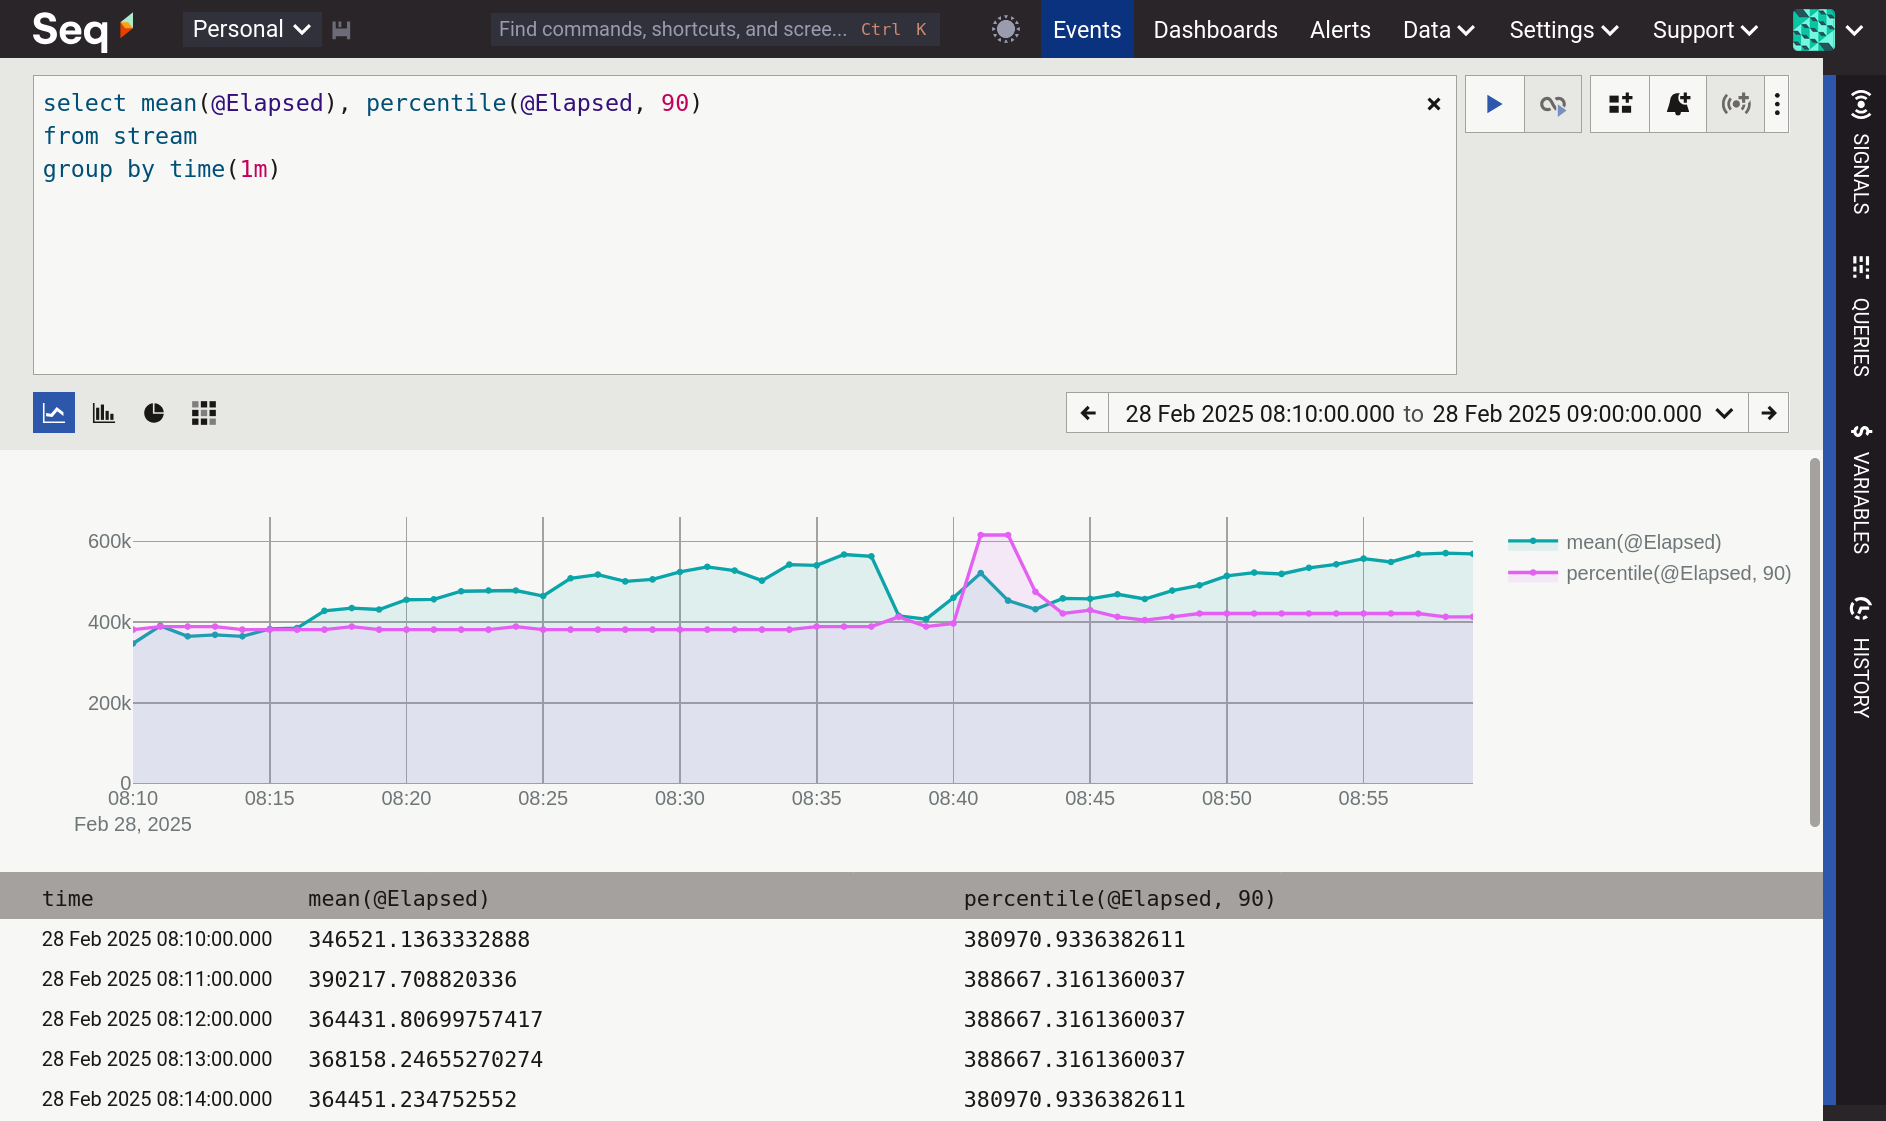
The view selector is a row of icons representing timeseries, bar, pie and heatmap views.
Basic Syntax
The syntax of a query in Seq is:
select [<column> [as <label>],]
[from stream
  [[lateral unnest(<arr>) as <label>]]
  [where <predicate>]
  [group by [time(<d>)|<grouping>,]]
  [having <predicate>]
  [order by [time|<label>] [asc|desc]]
  [limit <n>]
  [for refresh]]
The from stream clause indicates the query will run over the event stream currently being viewed, with any active signals used to filter results.
Expressions in a query use SQL-style
'single quoted'strings and familiar SQL operators such asand,or,notandlike. Comments begin with--and continue to the end of the line.
Tabular Queries
The simplest queries pluck properties out of events into columns.
select RequestMethod, RequestPath, StatusCode
from stream
where StatusCode > 399
This produces a rowset:
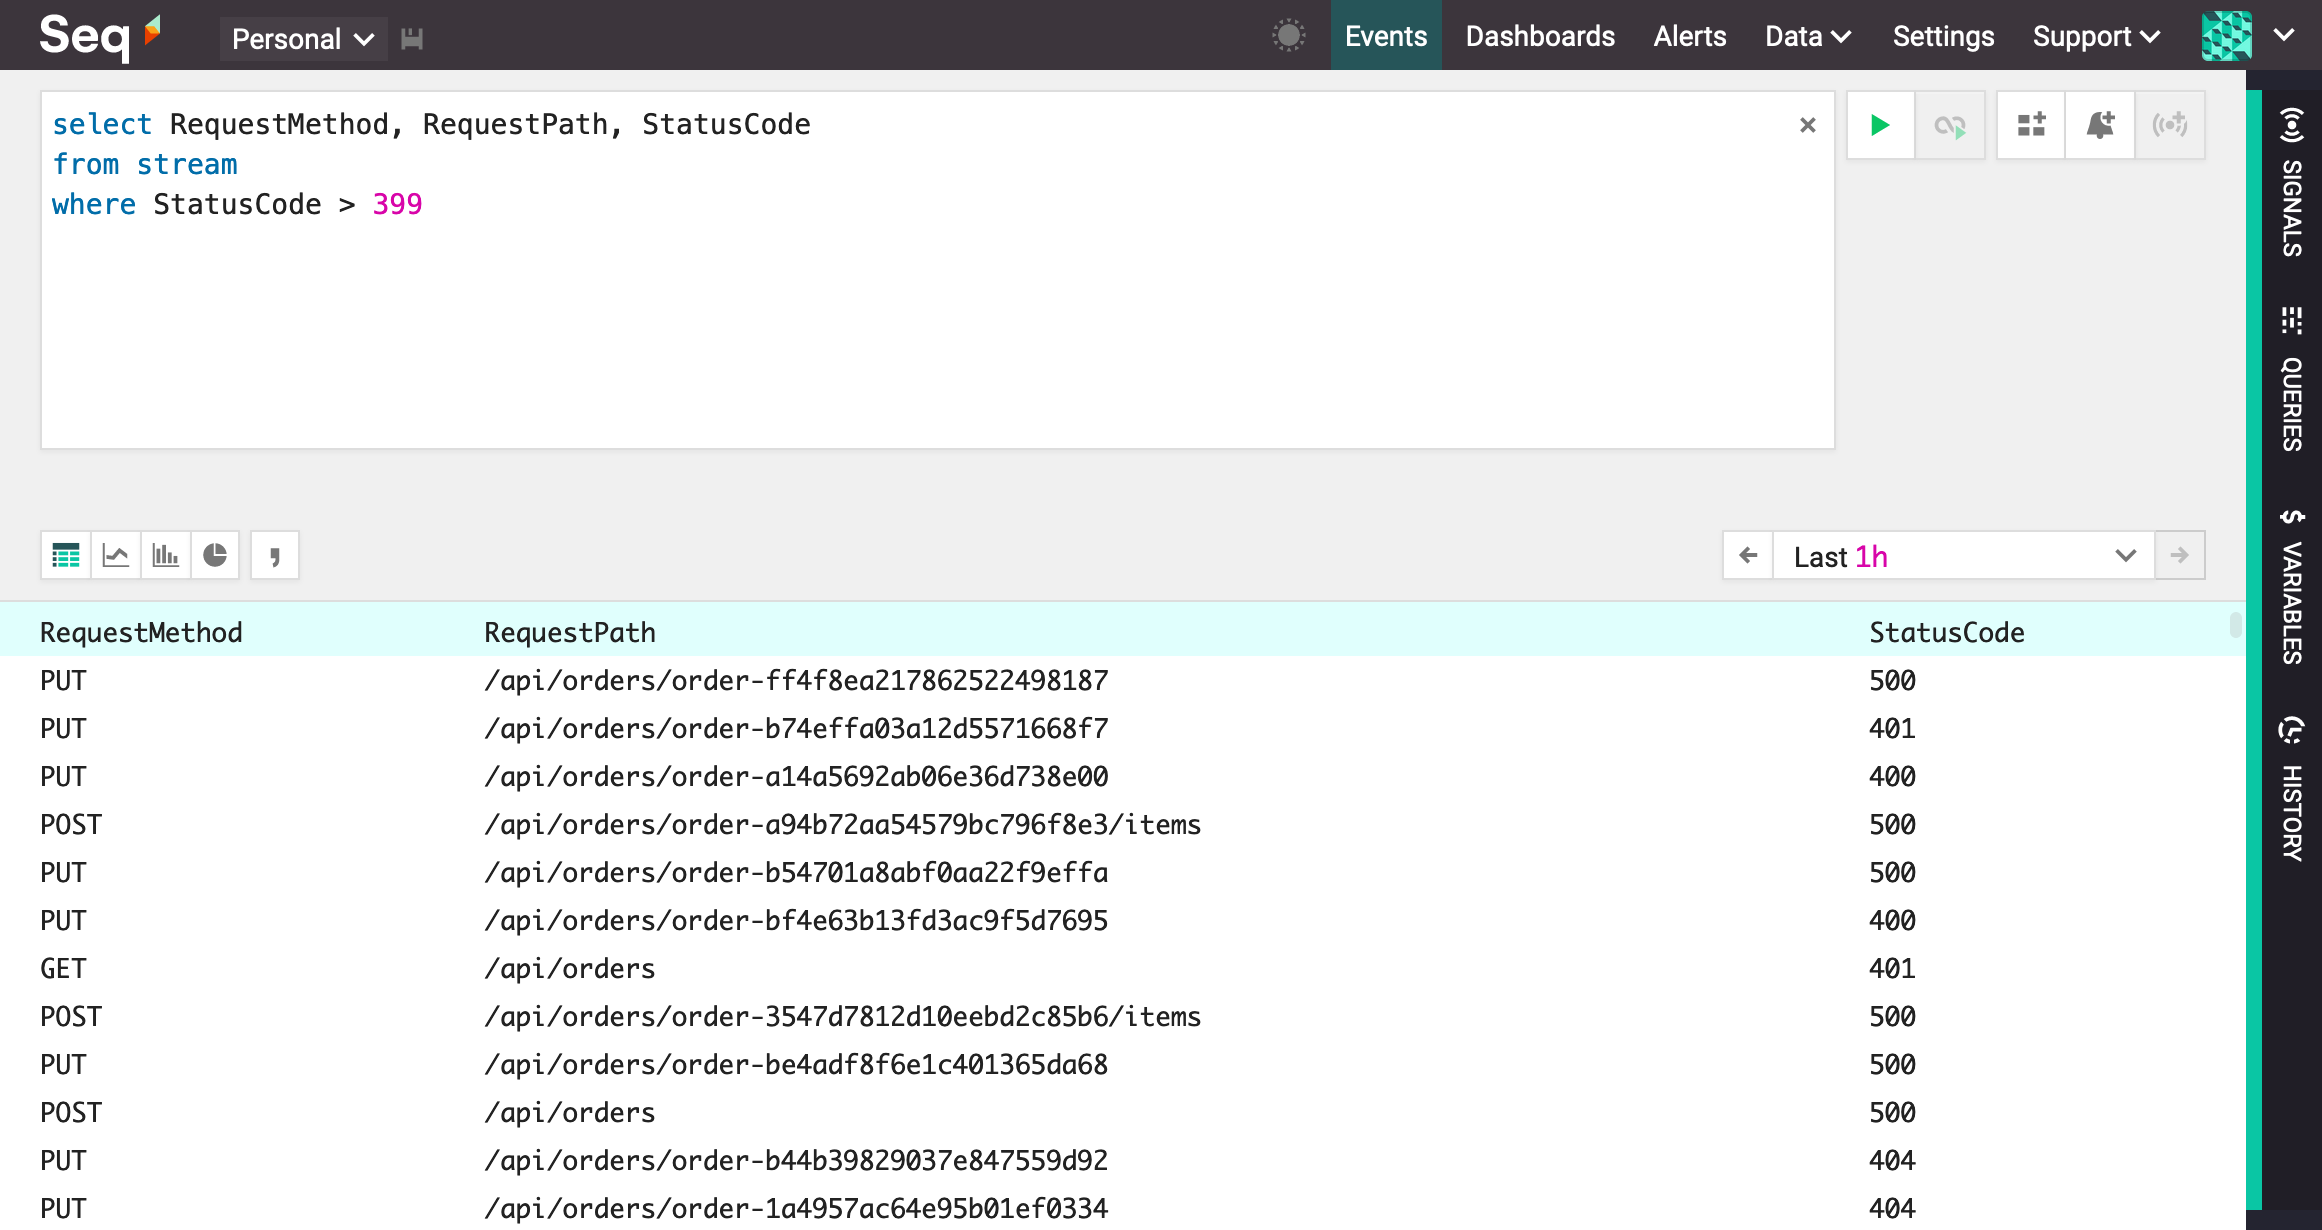
A tabular projection query
In many queries, Seq requires that a time range is specified using the date range picker in the Seq web interface. By default the last 24 hours will be included; use the calendar drop down to change the time range and refresh the query.
Tabular queries are great for exporting comma-separated text files from Seq. Use the drop-down beside the refresh button to download results in CSV format.
Limits
Seq automatically limits the size of rowsets that can be computed using queries, and returns an error if a rowset would exceed the default limit.
To override the limit, specifying a limit clause will take a subset of results:
select Method, RequestPath, StatusCode
from stream
where StatusCode > 399
limit 100
The limit clause is specified last, after any conditions or groupings.
Instead of specifying a limit directly, it's usually possible to select a shorter time range using the date picker controls, or group the query at a coarser level.
When a query is executed, options to display the data as a a bar or pie chart will appear to the bottom left of the filter bar. Selecting one of these will display the rowset in a chart of that kind.
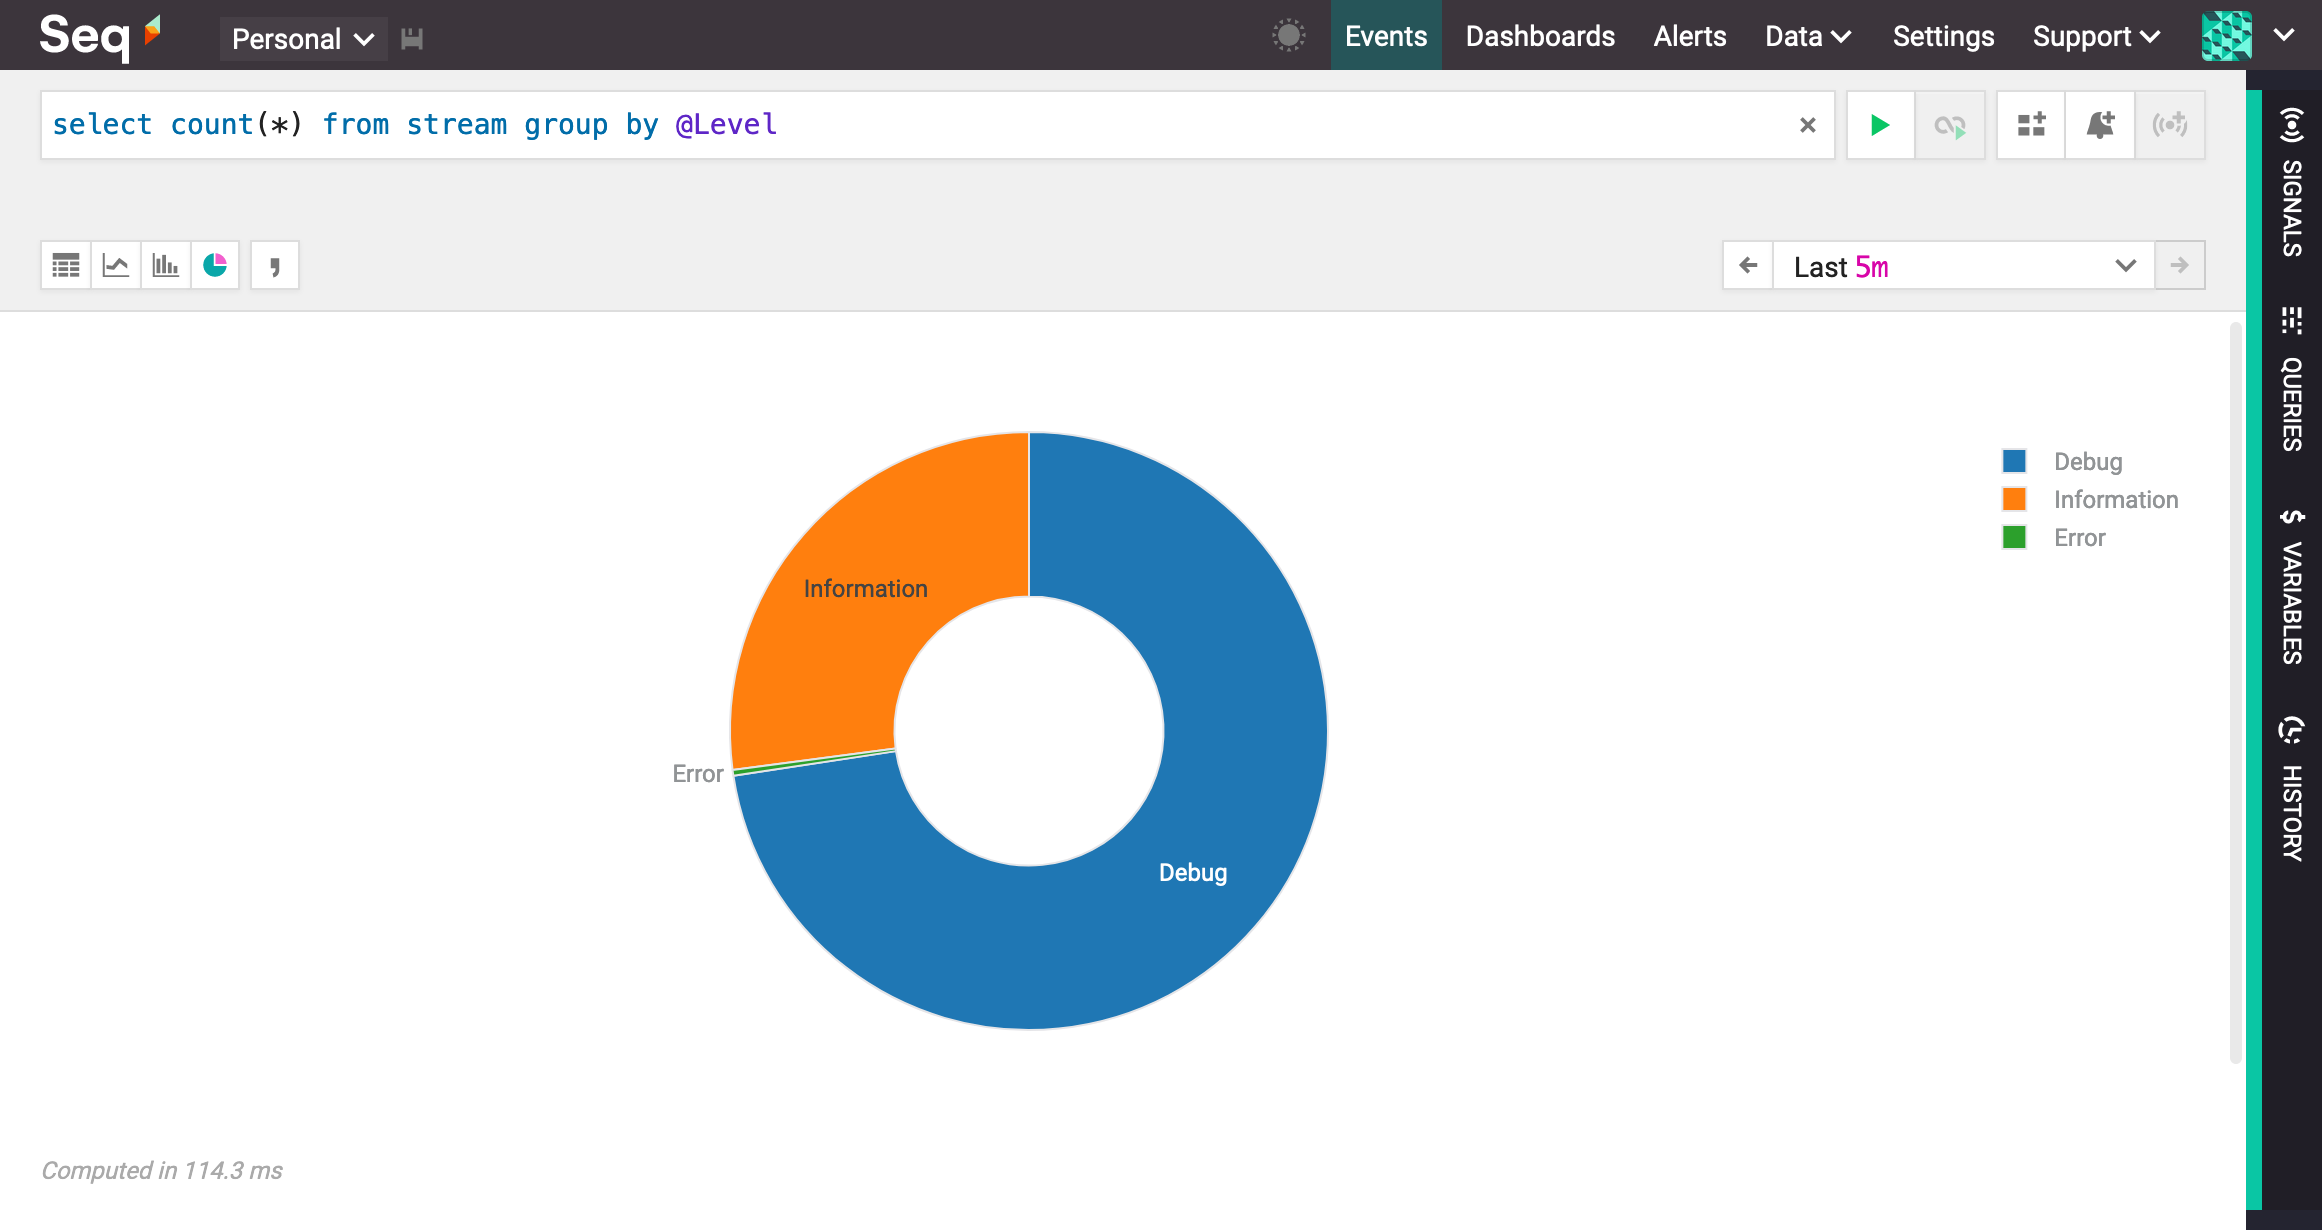
Viewing a query as a pie
Aggregate Operators
Most uses for SQL queries in Seq involve aggregate operators. These provide familiar computations like count, sum, min/max/mean/percentile and distinct.
select count(*)
from stream
group by RequestPath
This produces a rowset:
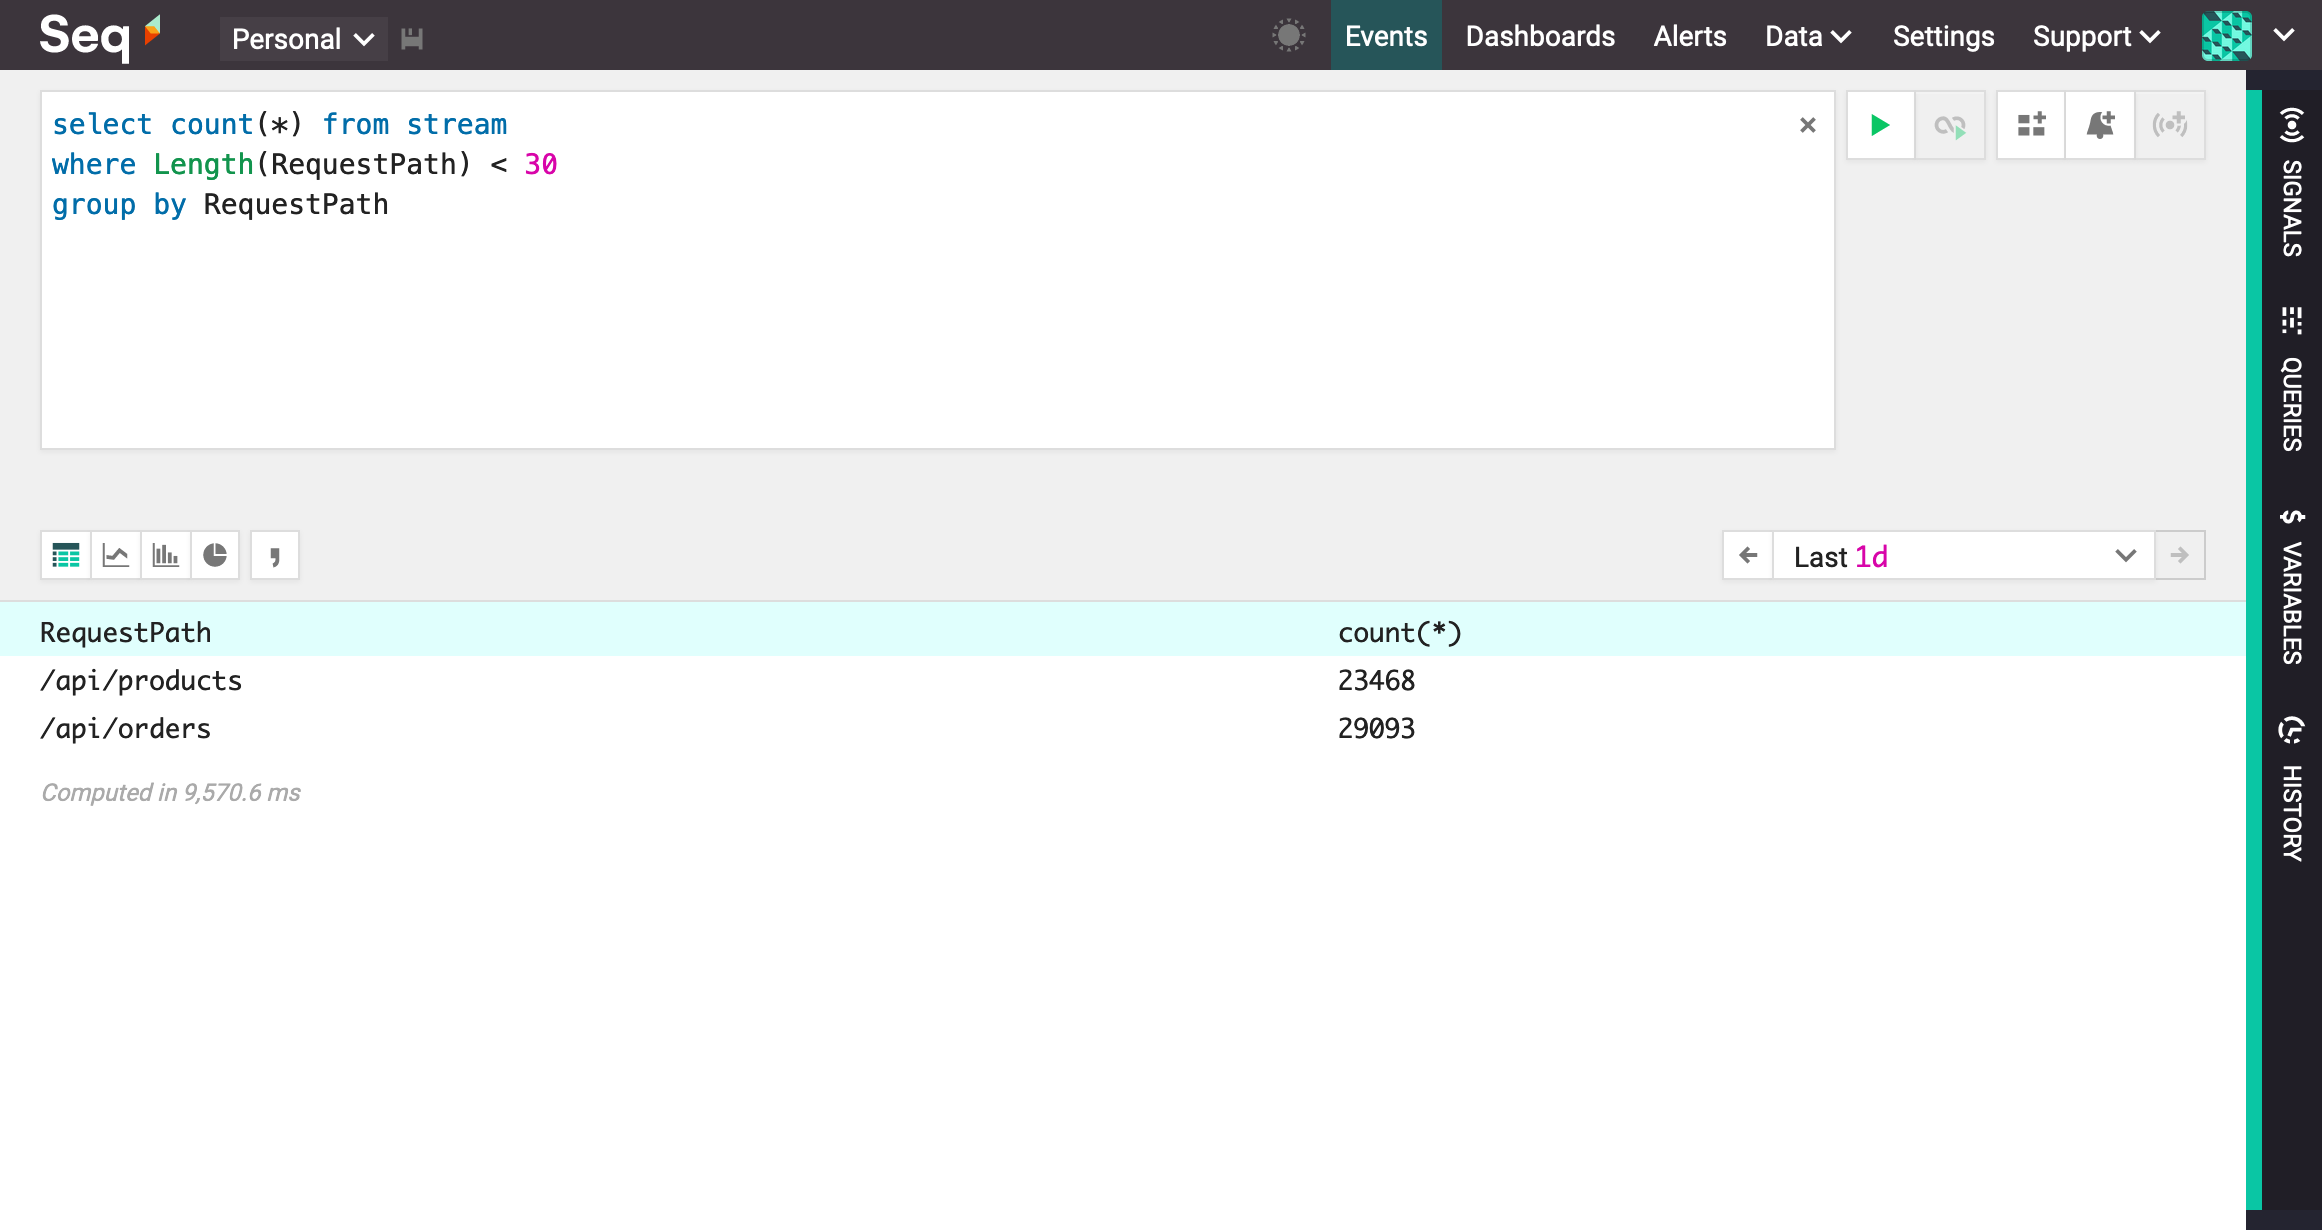
Using the count aggregate operator
View the full list of aggregate operators.
Time-Slicing Queries
Rather than compute aggregates across the entire time range, a time slice grouping can be used.
select mean(Elapsed)
from stream
group by RequestPath, time(1m)
Time slicing expressions can group events by a number of days (d), hours (h), minutes (m), seconds (s) or milliseconds (ms).
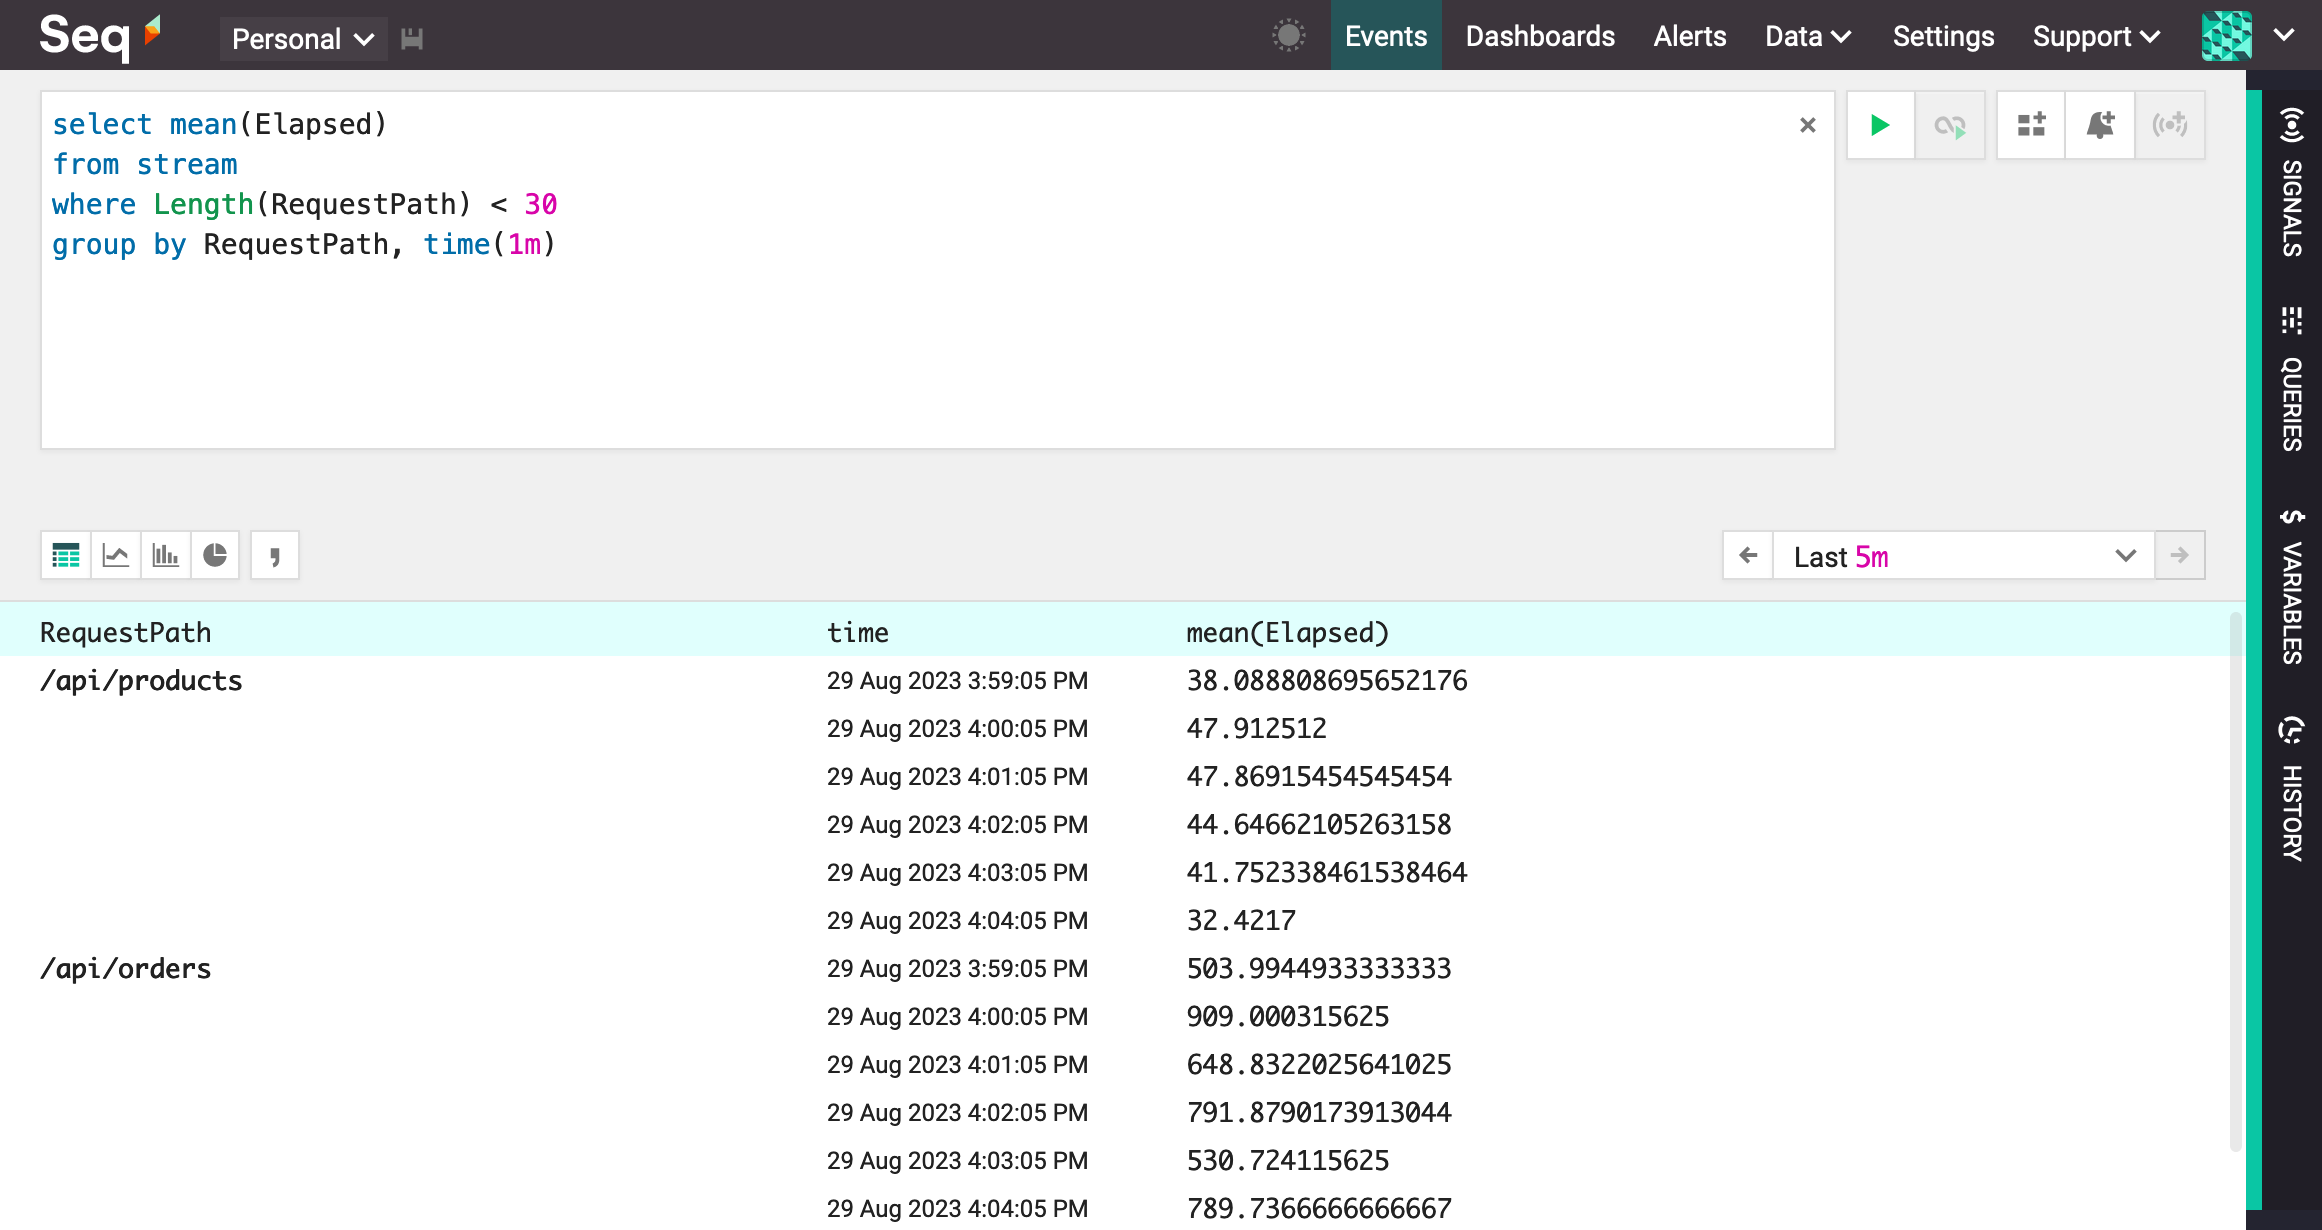
A query that groups by RequestPath and one minute time slices
To retrieve the most-recent results first, specify order by time desc in the query.
Timeseries Result
The
time()grouping may be specified last to render the result in timeseries format. Note that in this configuration,limitclauses will apply to the raw (un-filled) result set, solimit 5may return more than five rows.
Selecting the timeseries icon to the bottom-left of the filter bar will display the results in a timeseries chart.
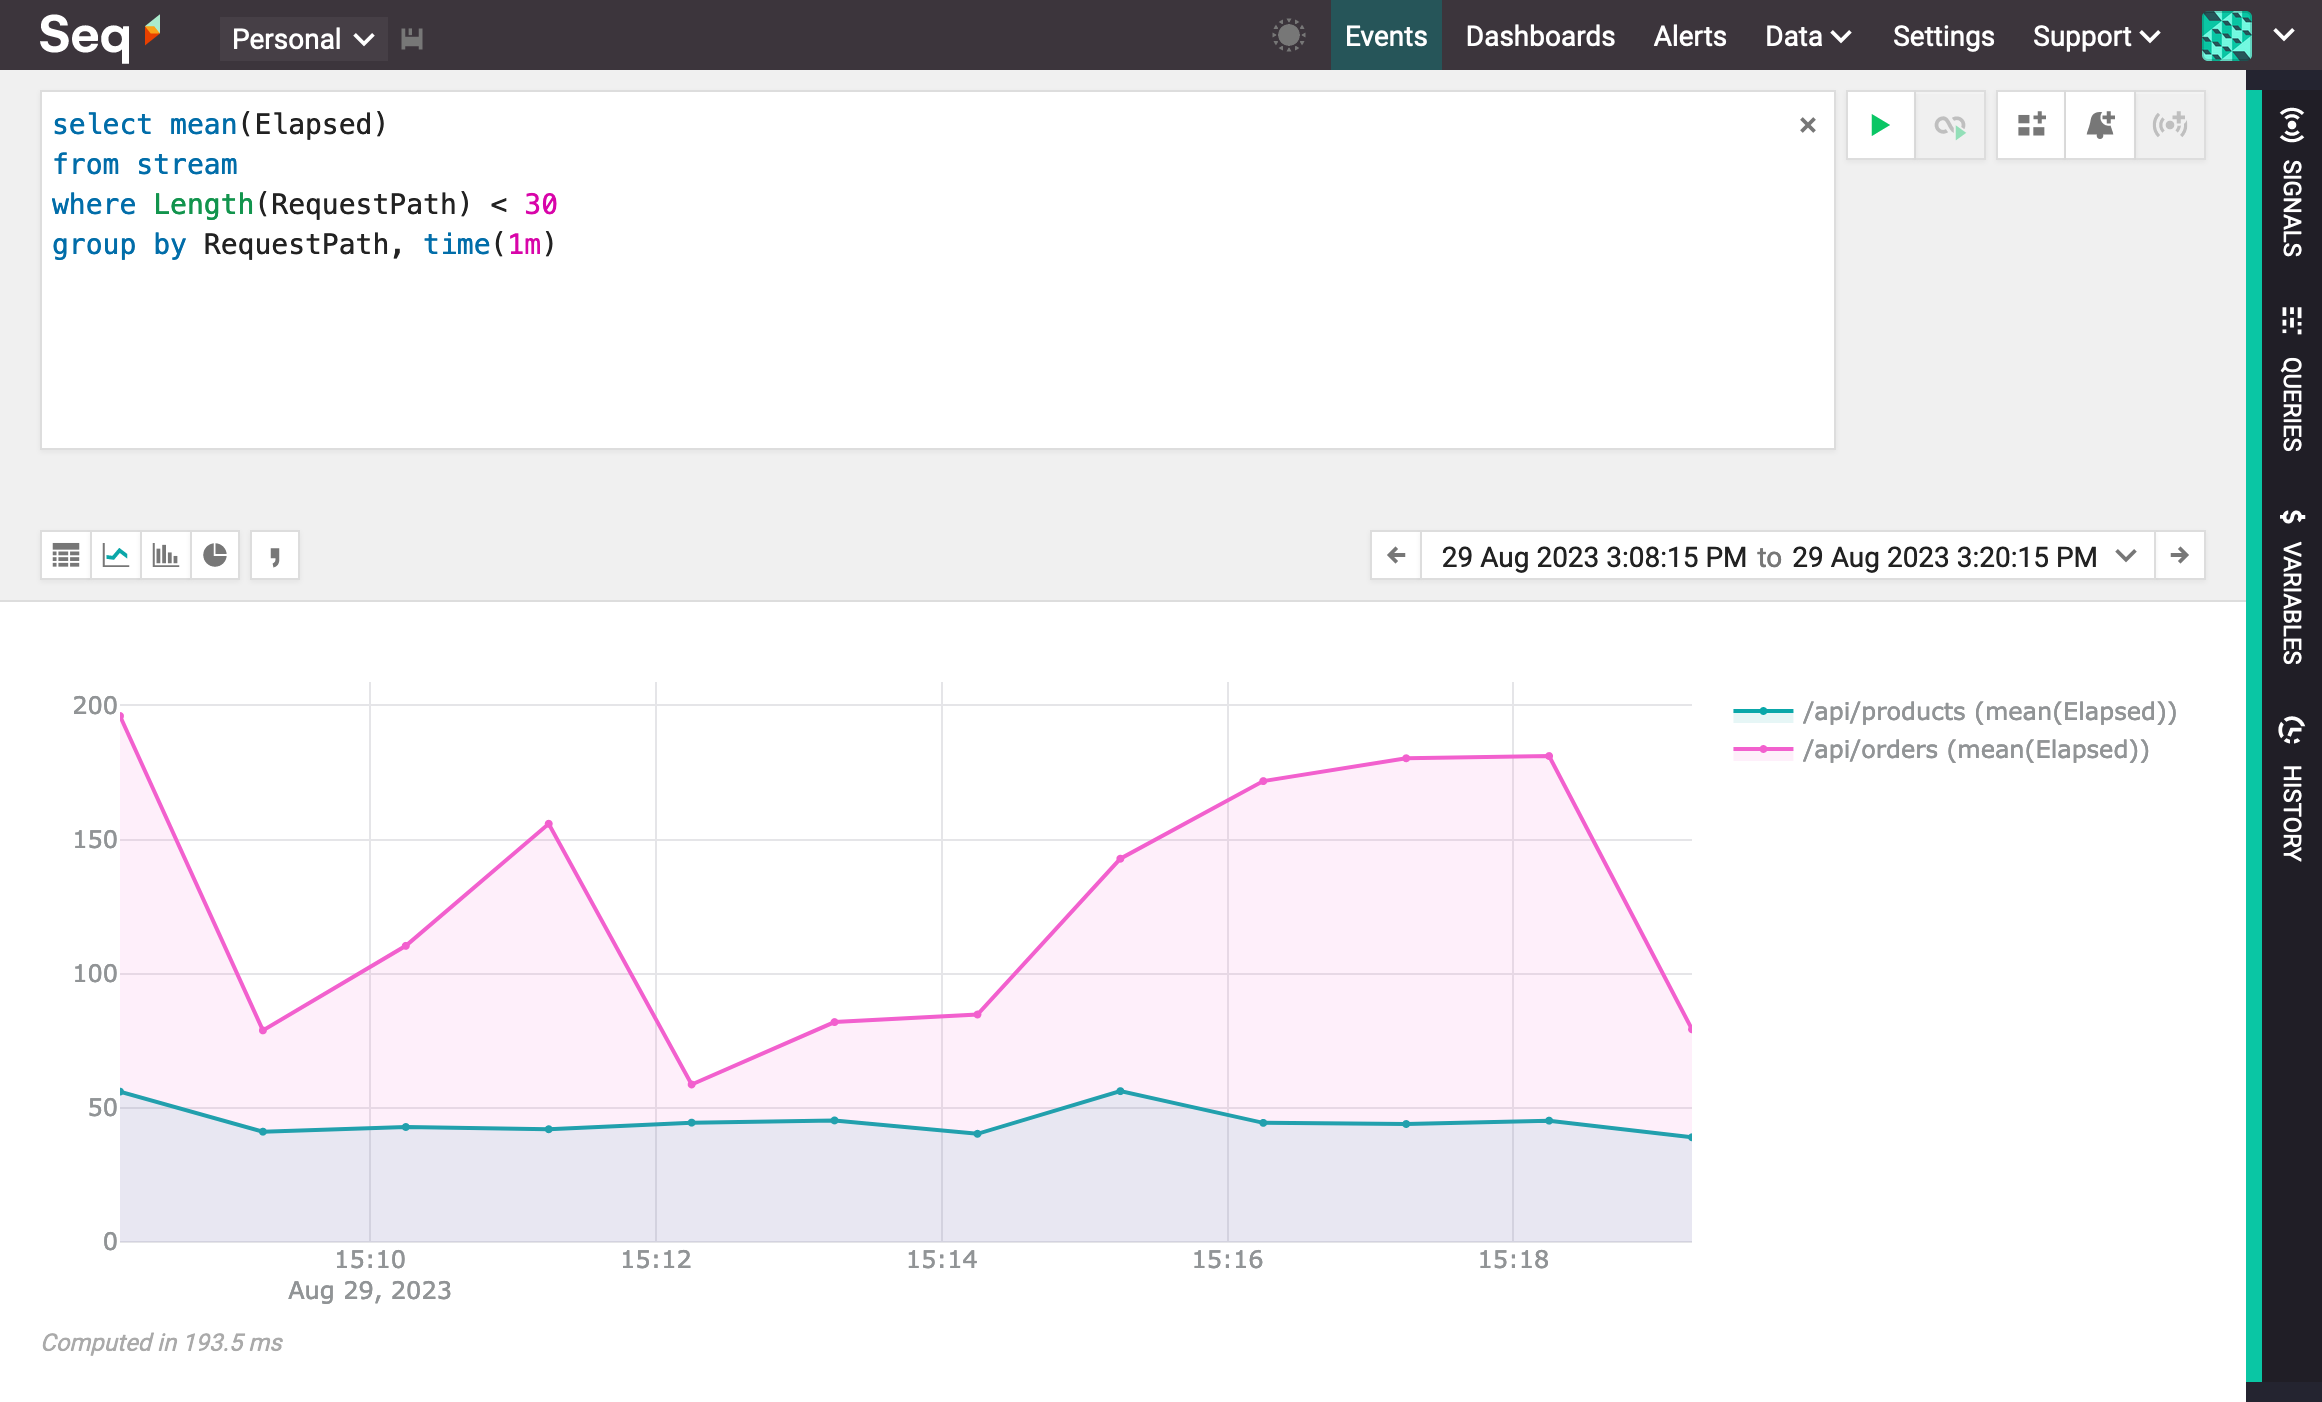
Displaying a timeseries chart
Cheat Sheet
Need a handy syntax reference to keep by your desk? We've put together a simple cheat sheet with query syntax and operator basics. Download the PDF here.
Updated about 1 month ago
