Tracing
Tracing reveals how systems and components work together in a complex operation. This comes in handy when:
- Understanding the performance costs of different system functions,
- Figuring out what chain of events led to a failure or interesting outcome, or
- Discovering the relationship between components in an unfamiliar system.
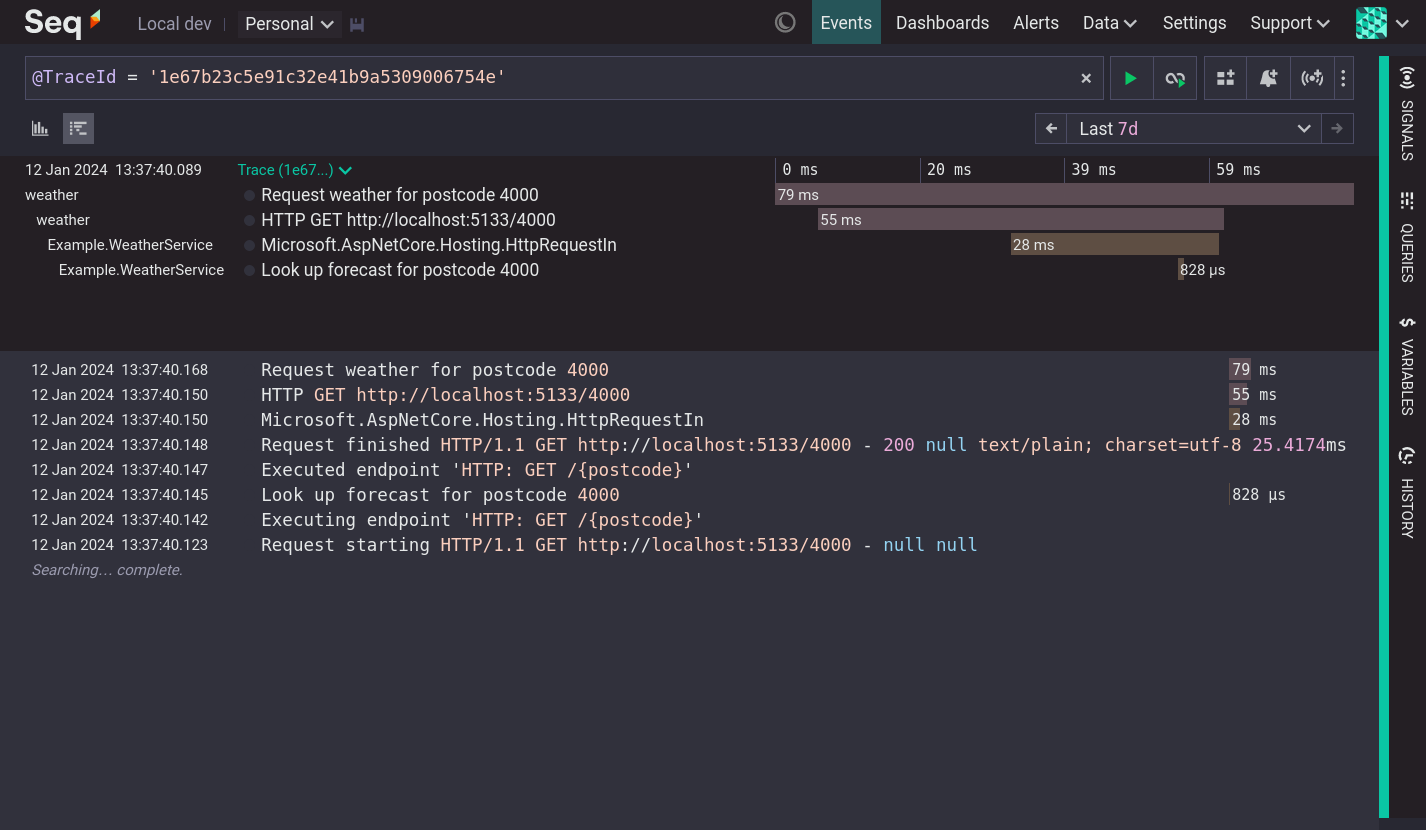
Distributed tracing tracks an operation across distributed components tracking the time taken by each step and the sequential flow of the operation. Events are captured as logs, spans and traces.
A span is a recorded event with a start time, an end time and an optional parent span id.
A trace is a set of spans and logs.

A distributed trace including spans and logs
Ingesting Traces
To work with traces in Seq you will need to configure a client to capture and send trace data. For .NET applications use SerilogTracing or the OpenTelemetry .NET SDK. For other environments see the 'Getting Traces Into Seq' section.
Traces in Seq
Seq events are considered to be spans if they include the following properties:
@SpanIdA unique identifier for the span@StartThe start timestamp of the span@ElapsedA convenience property containing@Timestamp - @Start, giving the duration of the span in Seq's native 100 nanosecond tick resolution, making filters like@Elapsed > 500mspossible.@TraceIdThe trace to which the span belongs@ParentId(optional) If a span is the child of another span, then it will carry its parent span's id in@ParentId.
Spans should also have a value in Application or @Resource.service.name that identifies the system that generated the span.
Span events are displayed inline with log events, with an additional duration indicator that shows the relative duration of the span. The duration indicator is colored based on the service name. Clicking on the duration indicator will display the full trace containing that span.

Trace events with
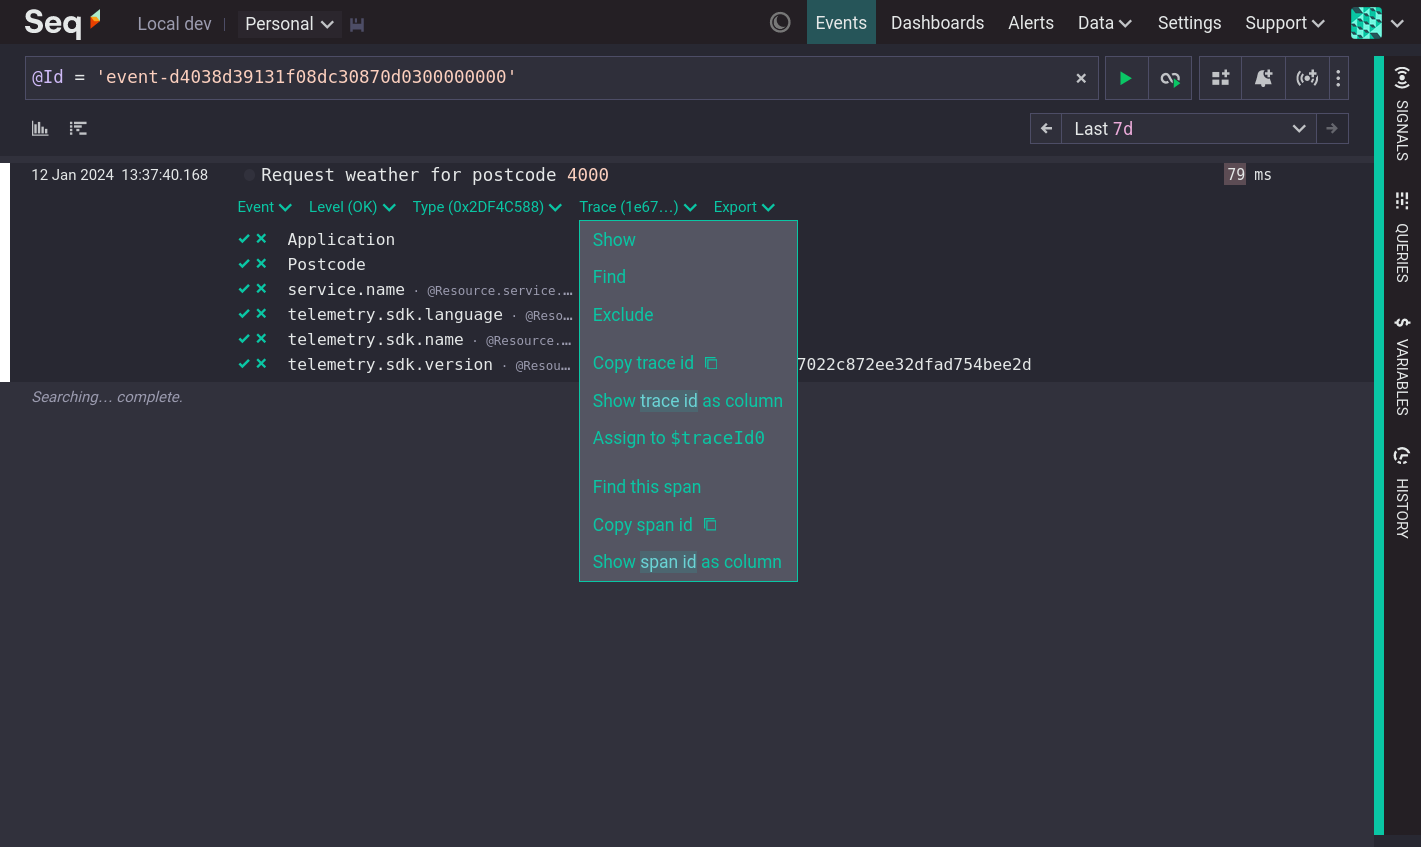
Spans also have an additional Trace menu containing tracing actions.

A span with its Trace menu open
Viewing a Trace
A trace visualization can be displayed at the top of the Events screen, in the same position used by the Frequency Histogram.
To display a trace, find an event that is part of a trace and:
- choose Find from the event's Trace menu, or
- choose Show from the event's Trace menu, or
- (spans only) click on the duration indicator

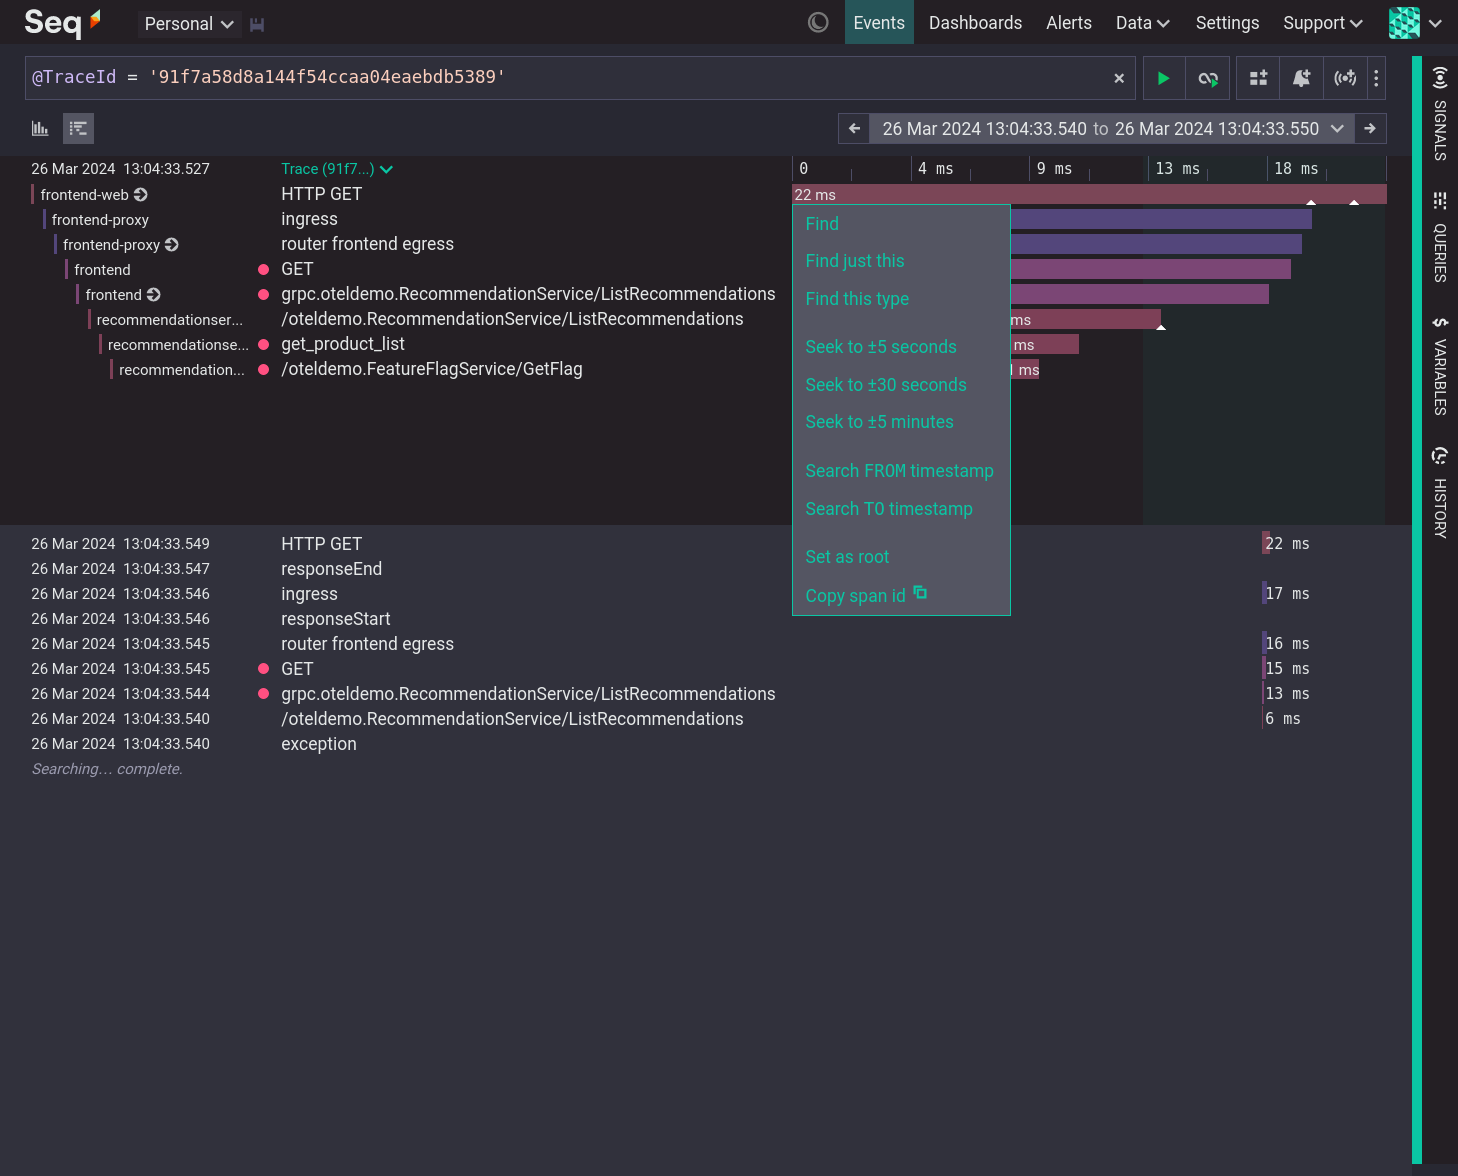
A trace with many spans and a number of logs
Each line in the trace visualization represents one span.
The left column shows the name of the service, indented based upon the hierarchy of the spans. Clicking on this column collapses and expands sub trees of the trace.
The selected time range is highlighted in the trace view if it does not cover the entire trace.
Each span has a colored bar on the timeline, positioned to show its start and duration. Hovering over the bar shows the precise duration and start time of the span. Any log events that are part of the span, and the current search results, are indicated by a small triangle icon. Clicking on the bar opens a menu of span actions. The Set as root action redraws the trace visualization showing only the selected span and its descendants.
If the current search time range is less than the time range of the trace then the current search range is highlighted on the timeline.
Updated about 1 month ago
