Alerting
Seq can notify you when your app is broken, when an operation is slow, when particular business events occur, or when something you expect to happen, doesn't.

A view of the Seq alerts dashboard.
How do alerts work?
An alert is based on a query that counts or otherwise aggregates properties from the stream of events.
The simplest kind of alert query runs over a signal like Errors, counts events within a time window, and triggers when the count exceeds some threshold:
select count(*) as count
from stream
group by time(1m)
having count > 0
Seq runs the query periodically, and if the query produces any rows, notifications are sent. This alert query will trigger notifications whenever any errors occur. The group by time(1m) clause ensures that if a burst of errors occurs, these are grouped up into a single notification.
You won't need to construct the exact query yourself: Seq will build it for you based on the details you enter into the Alert Editor.
Alert queries use the
havingclause to represent the "trigger condition", and awhereclause (if present) to identify "contributing events" (more on this below!).
Other variations are to alert when the count is zero, or to alert on min, max, mean, or percentile values for a property.
What do notifications look like?
Notifications are usually messages sent to a communication channel like Slack, Teams, or email. The content of an alert notification depends on the channel it's sent over.
Alerts sent by email are comparatively detailed, including the full result set and (optional) contributing events:
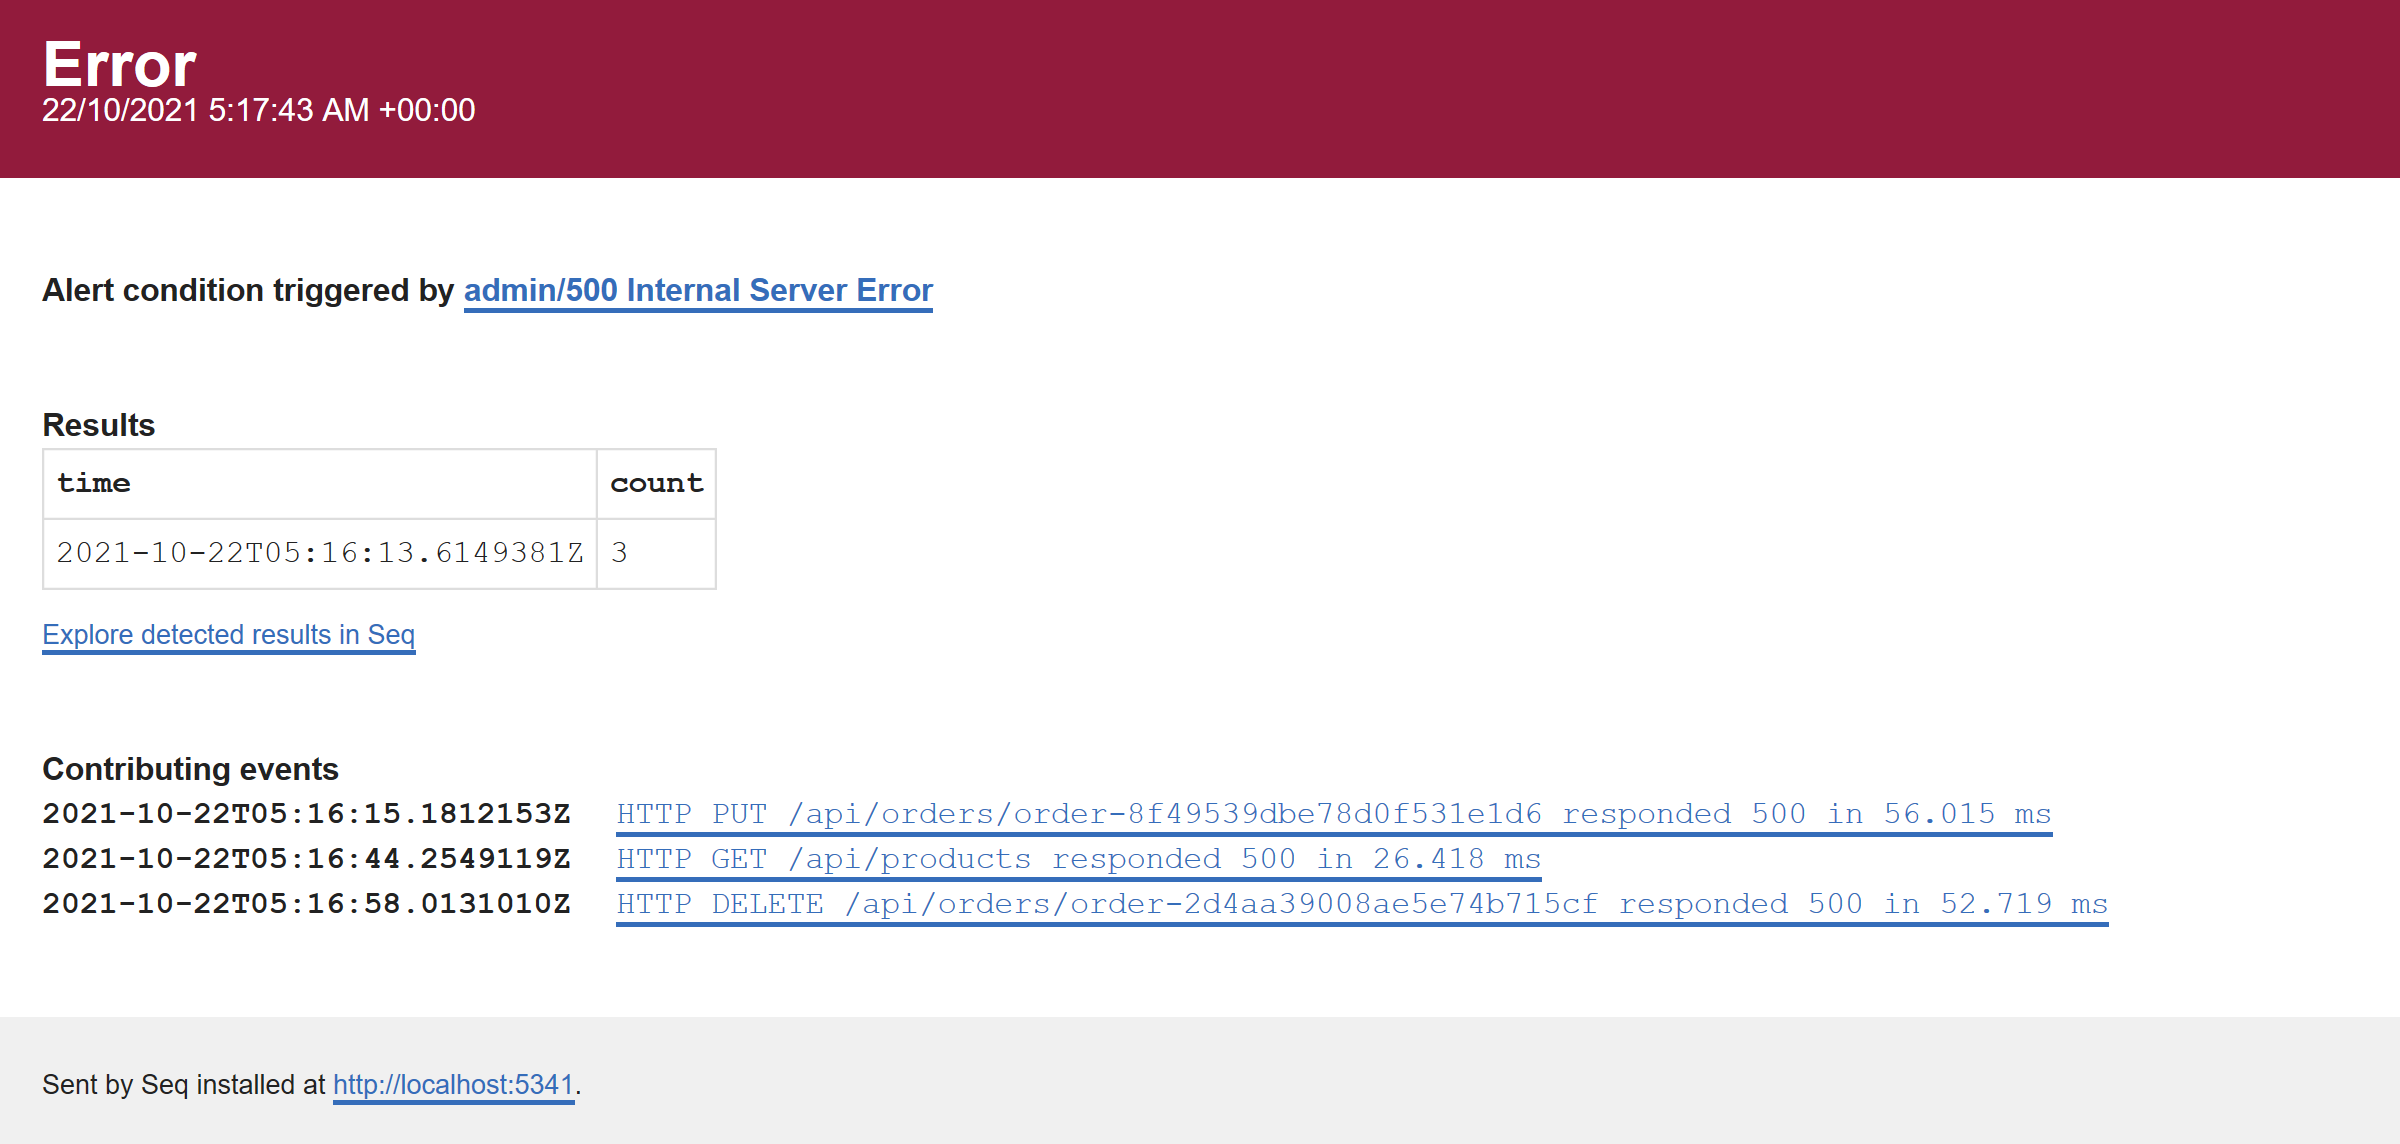
An alert notification formatted as HTML email. The notification includes the result rowset, and a selection of events that contributed to the alert.
Slack notifications are more compact:
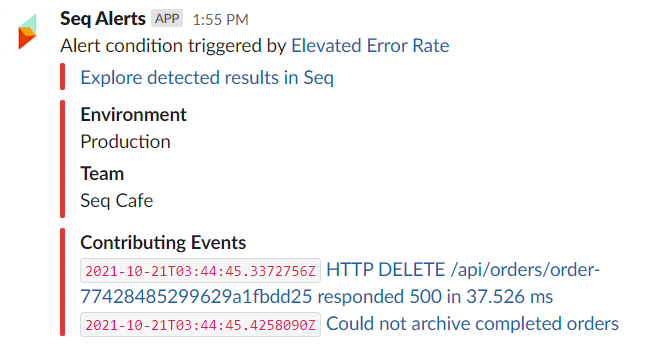
An alert notification displayed in Slack. The notification includes two notification properties, Environment and Team, along with two of the events that contributed to the alert.
Some notification channels will include only the alert message.
Before you begin...
Before you can create alerts, you (or your Seq administrator) will need to configure the Seq Apps that will be used for sending notifications.
You can find a list of popular output apps, and instructions for installing them, in the output app documentation.
Adding an instance of a simple output app (such as Seq.App.FileArchive) is a good way to test alerts.
Creating an alert
You can create alerts from a filter or SQL query in the Events screen, from a chart on a dashboard, or directly from the top-level Alerts screen.
We'll walk through creating an alert from a filter on the Events screen, in a few steps.
This example uses the sample signals and event data generated by the
seqcli sample setupandseqcli sample ingestcommands. If you have a non-production Seq instance handy, you can load the data up using these commands and follow along.
Step 1: Identify events to alert on
Our example alert will notify us whenever our app returns 500 (internal server error) from its HTTP API.
To do this, we first zoom in on the events of interest. In the screenshot below, we've selected the "HTTP Requests" signal, which will return all requests, and added StatusCode = 500 as a filter in the search box:
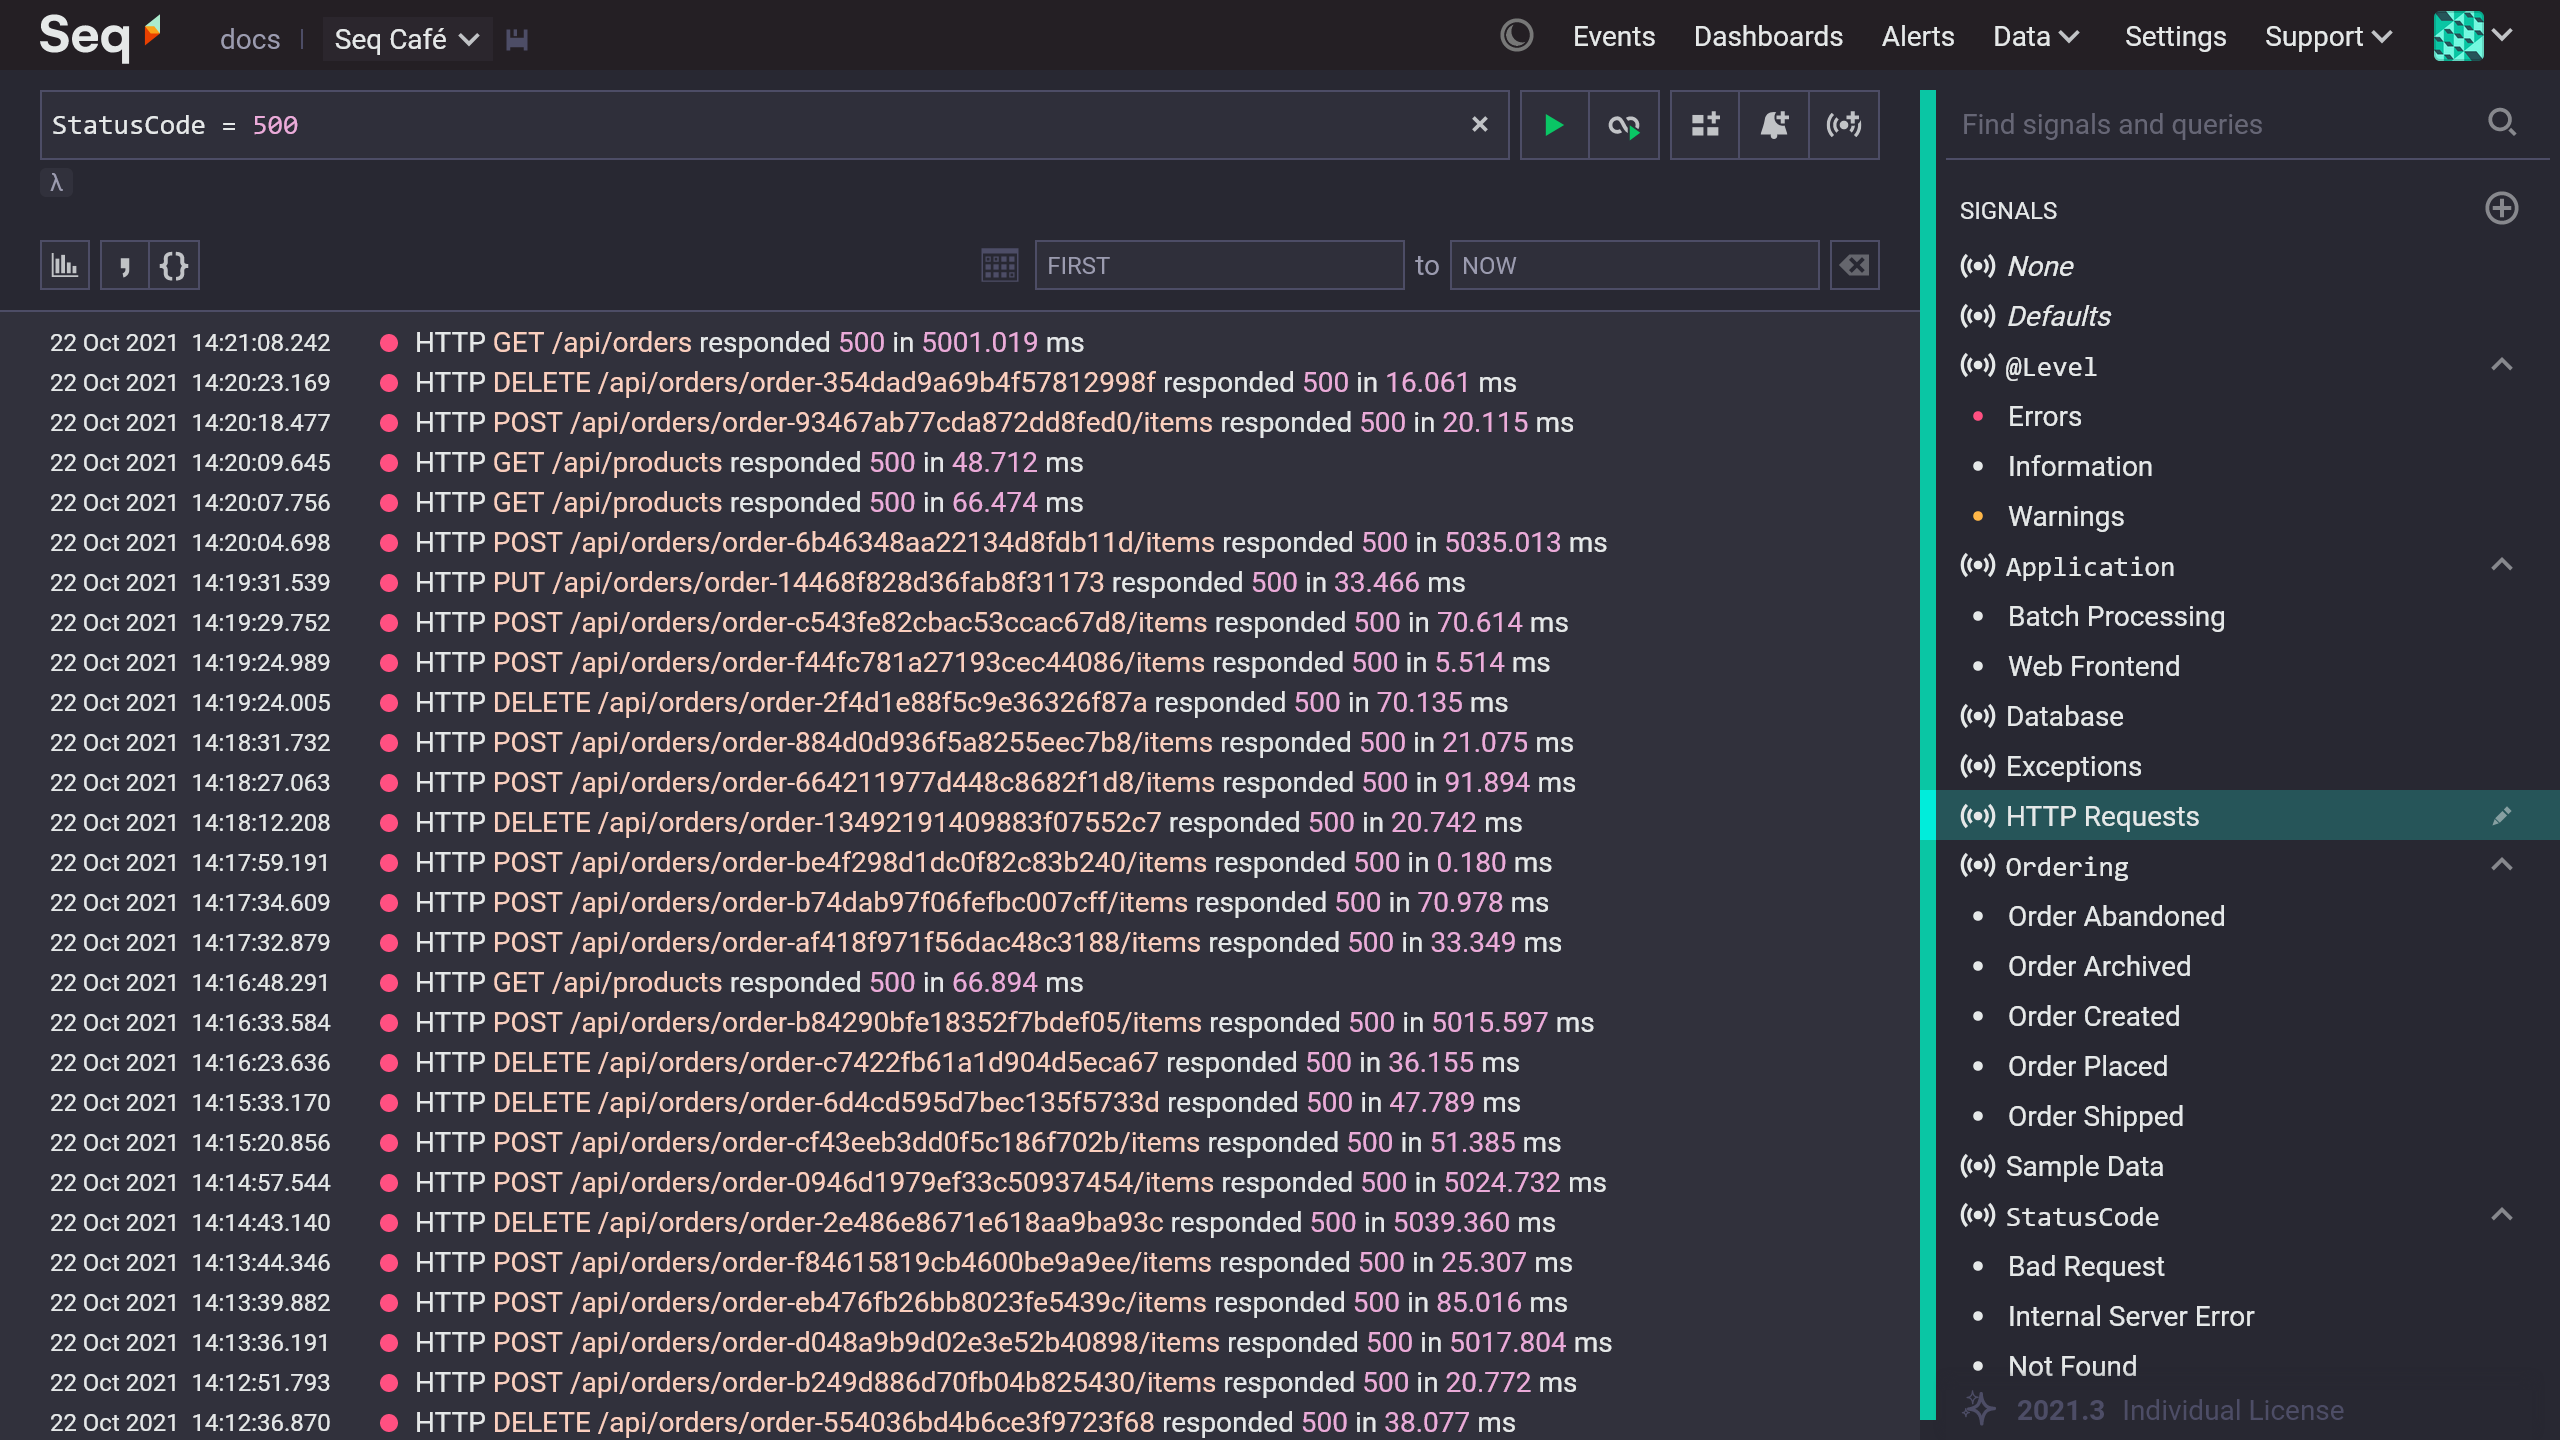
Seq Events screen, showing HTTP requests that resulted in a 500 status code.
These are the events we want to alert on. It looks like our web API has been pretty flaky! 😅
Step 2: Add an alert
To the right of the search box, you'll spot the Add Alert button. It looks like a bell with a small "plus" icon overlay.
Clicking takes us to the Alert Editor. Importantly, the signal we had selected ("HTTP Requests"), and the filter (StatusCode = 500) have been carried over. The filter is now a where clause.
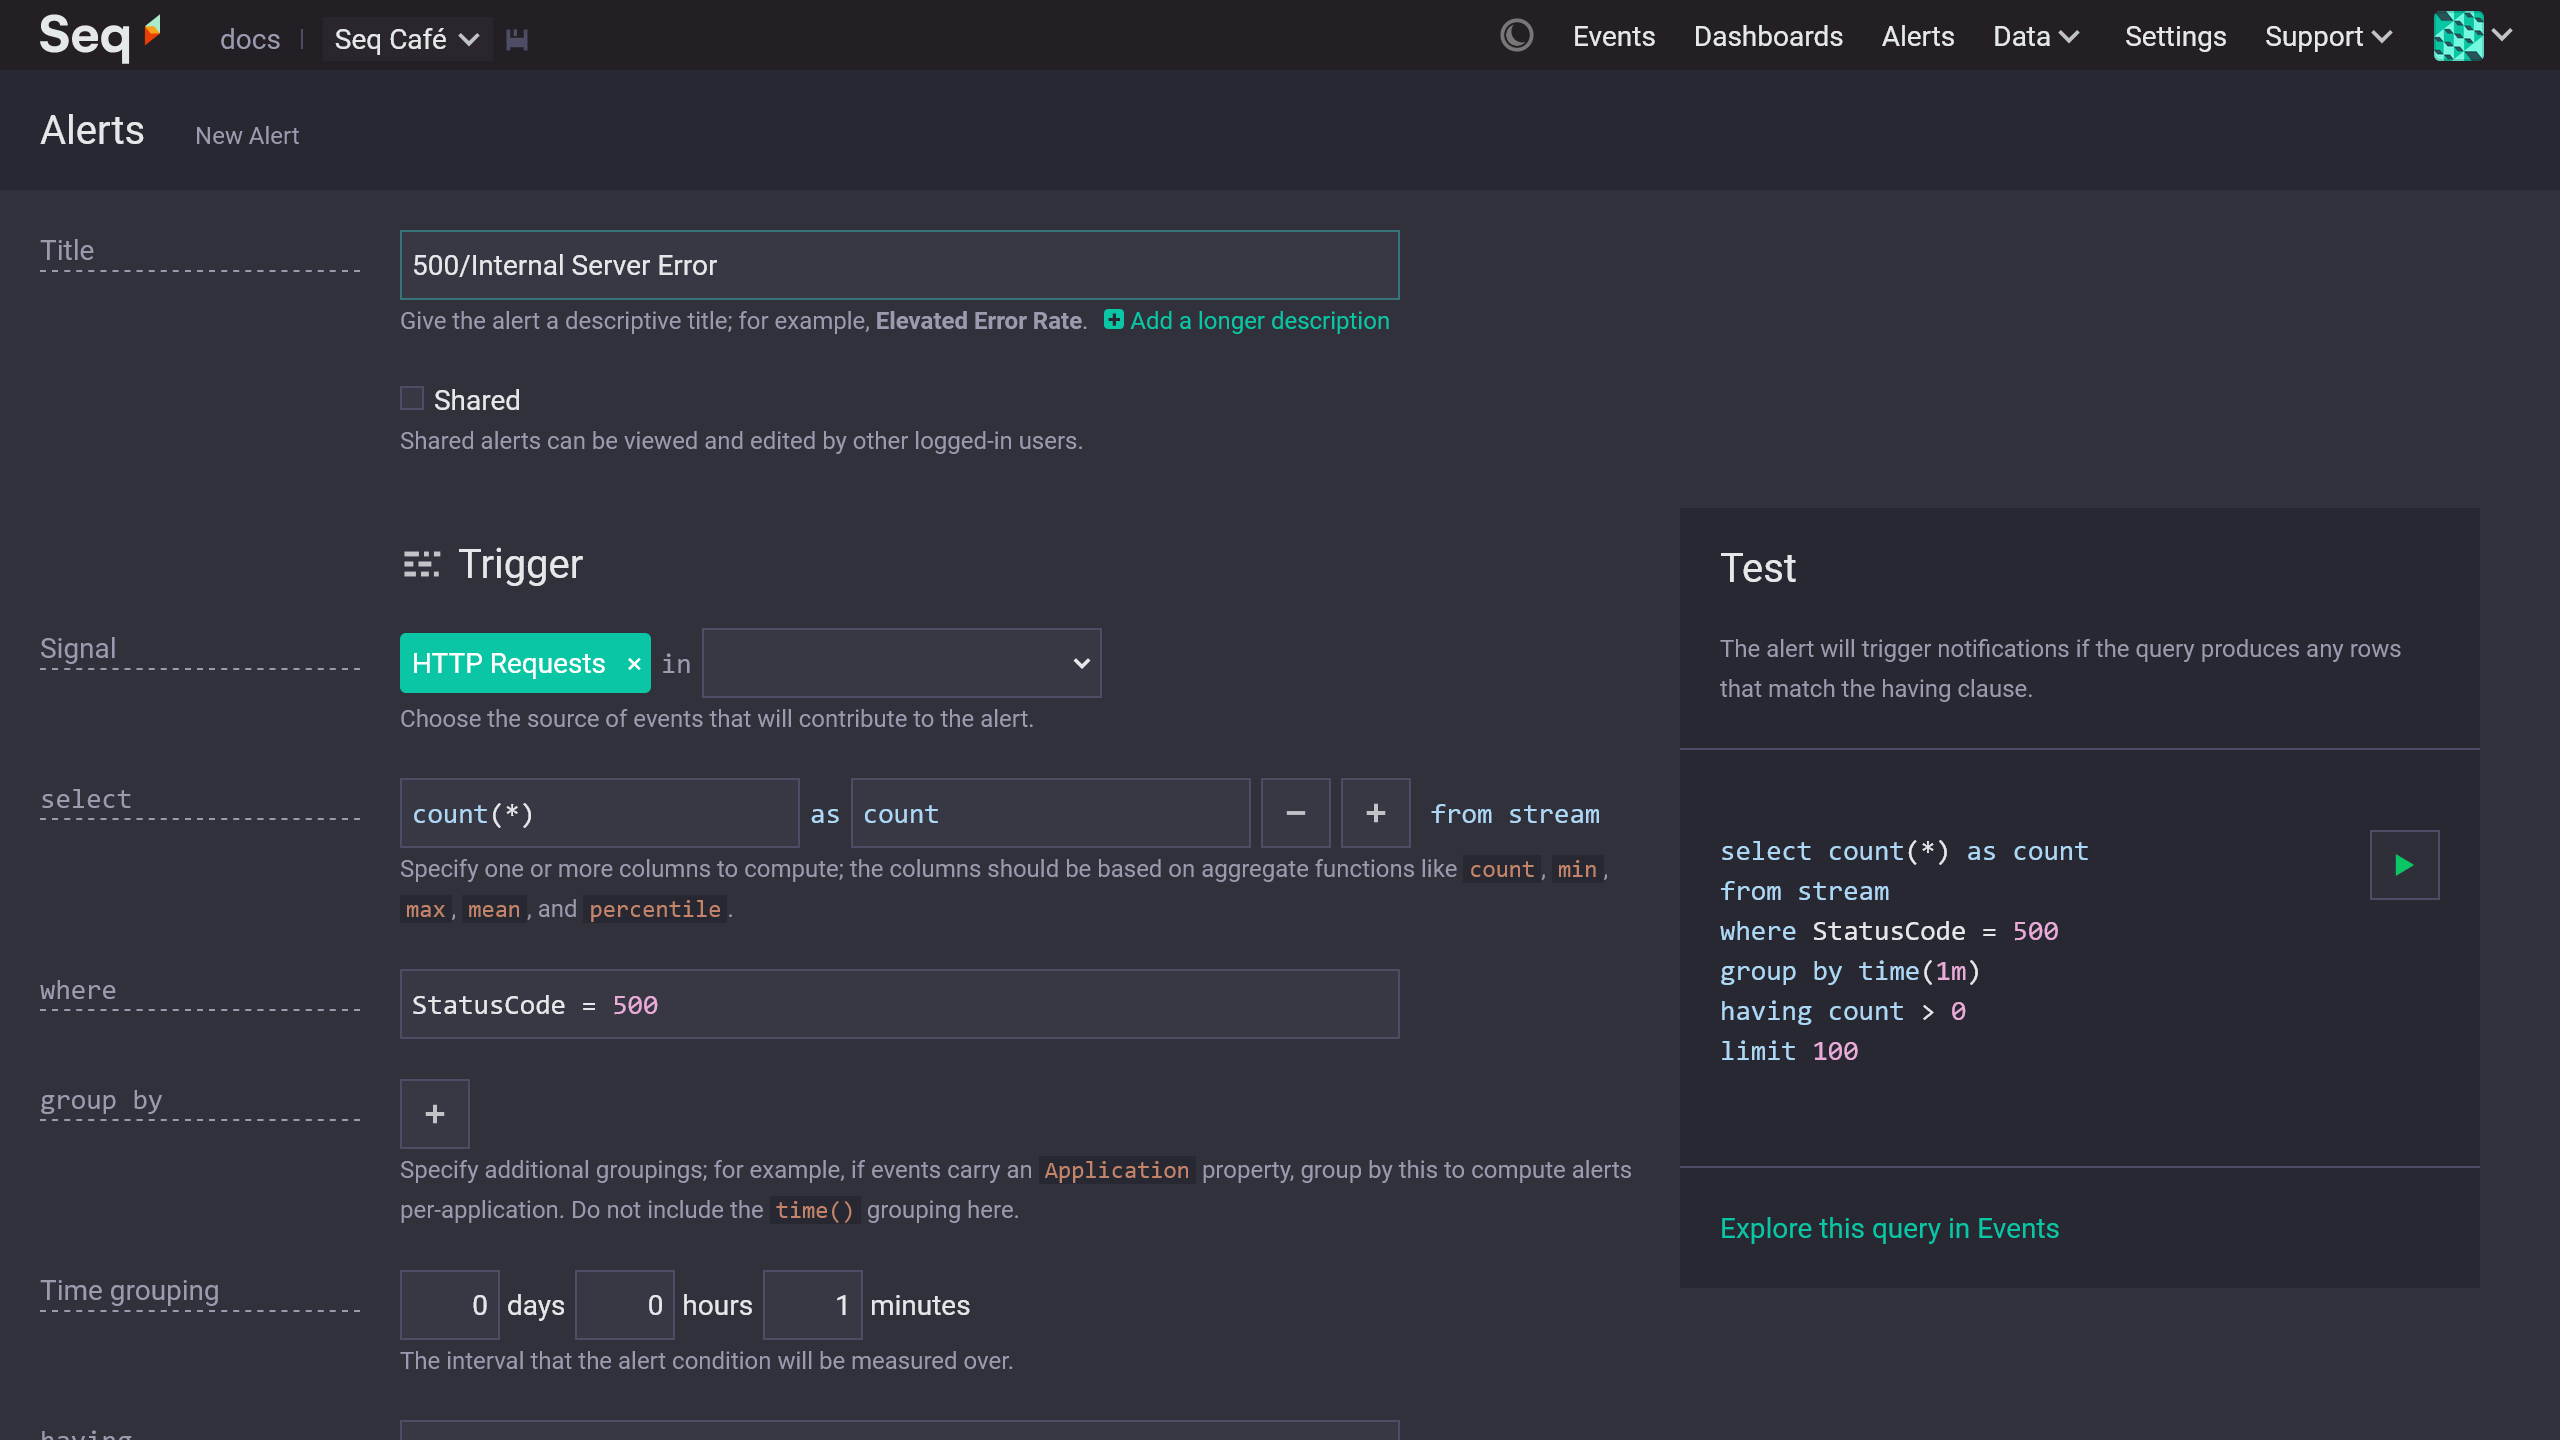
Alert Editor with properties carried over from Events.
Now's the time to give the alert a descriptive title, to decide whether to share it with the rest of your team, and to tweak the alert query.
Seq has generated a default trigger condition, having count > 0. If you're only interested in bursts of errors, you can change this to count > 10, for example.
Don't forget to check the alert's time grouping. By default, the alert query will aggregate events within a one minute window.
This can be a bit tight in some cases: if you can wait for a few minutes before receiving a notification, grouping the events up into ten minute to one hour windows can generate a lot less noise.
Step 3: Test the alert trigger (optional)
Over to the right of the edit form, you'll find the alert tester. Pressing the green "go" button executes the alert query over the last day of matching event data.
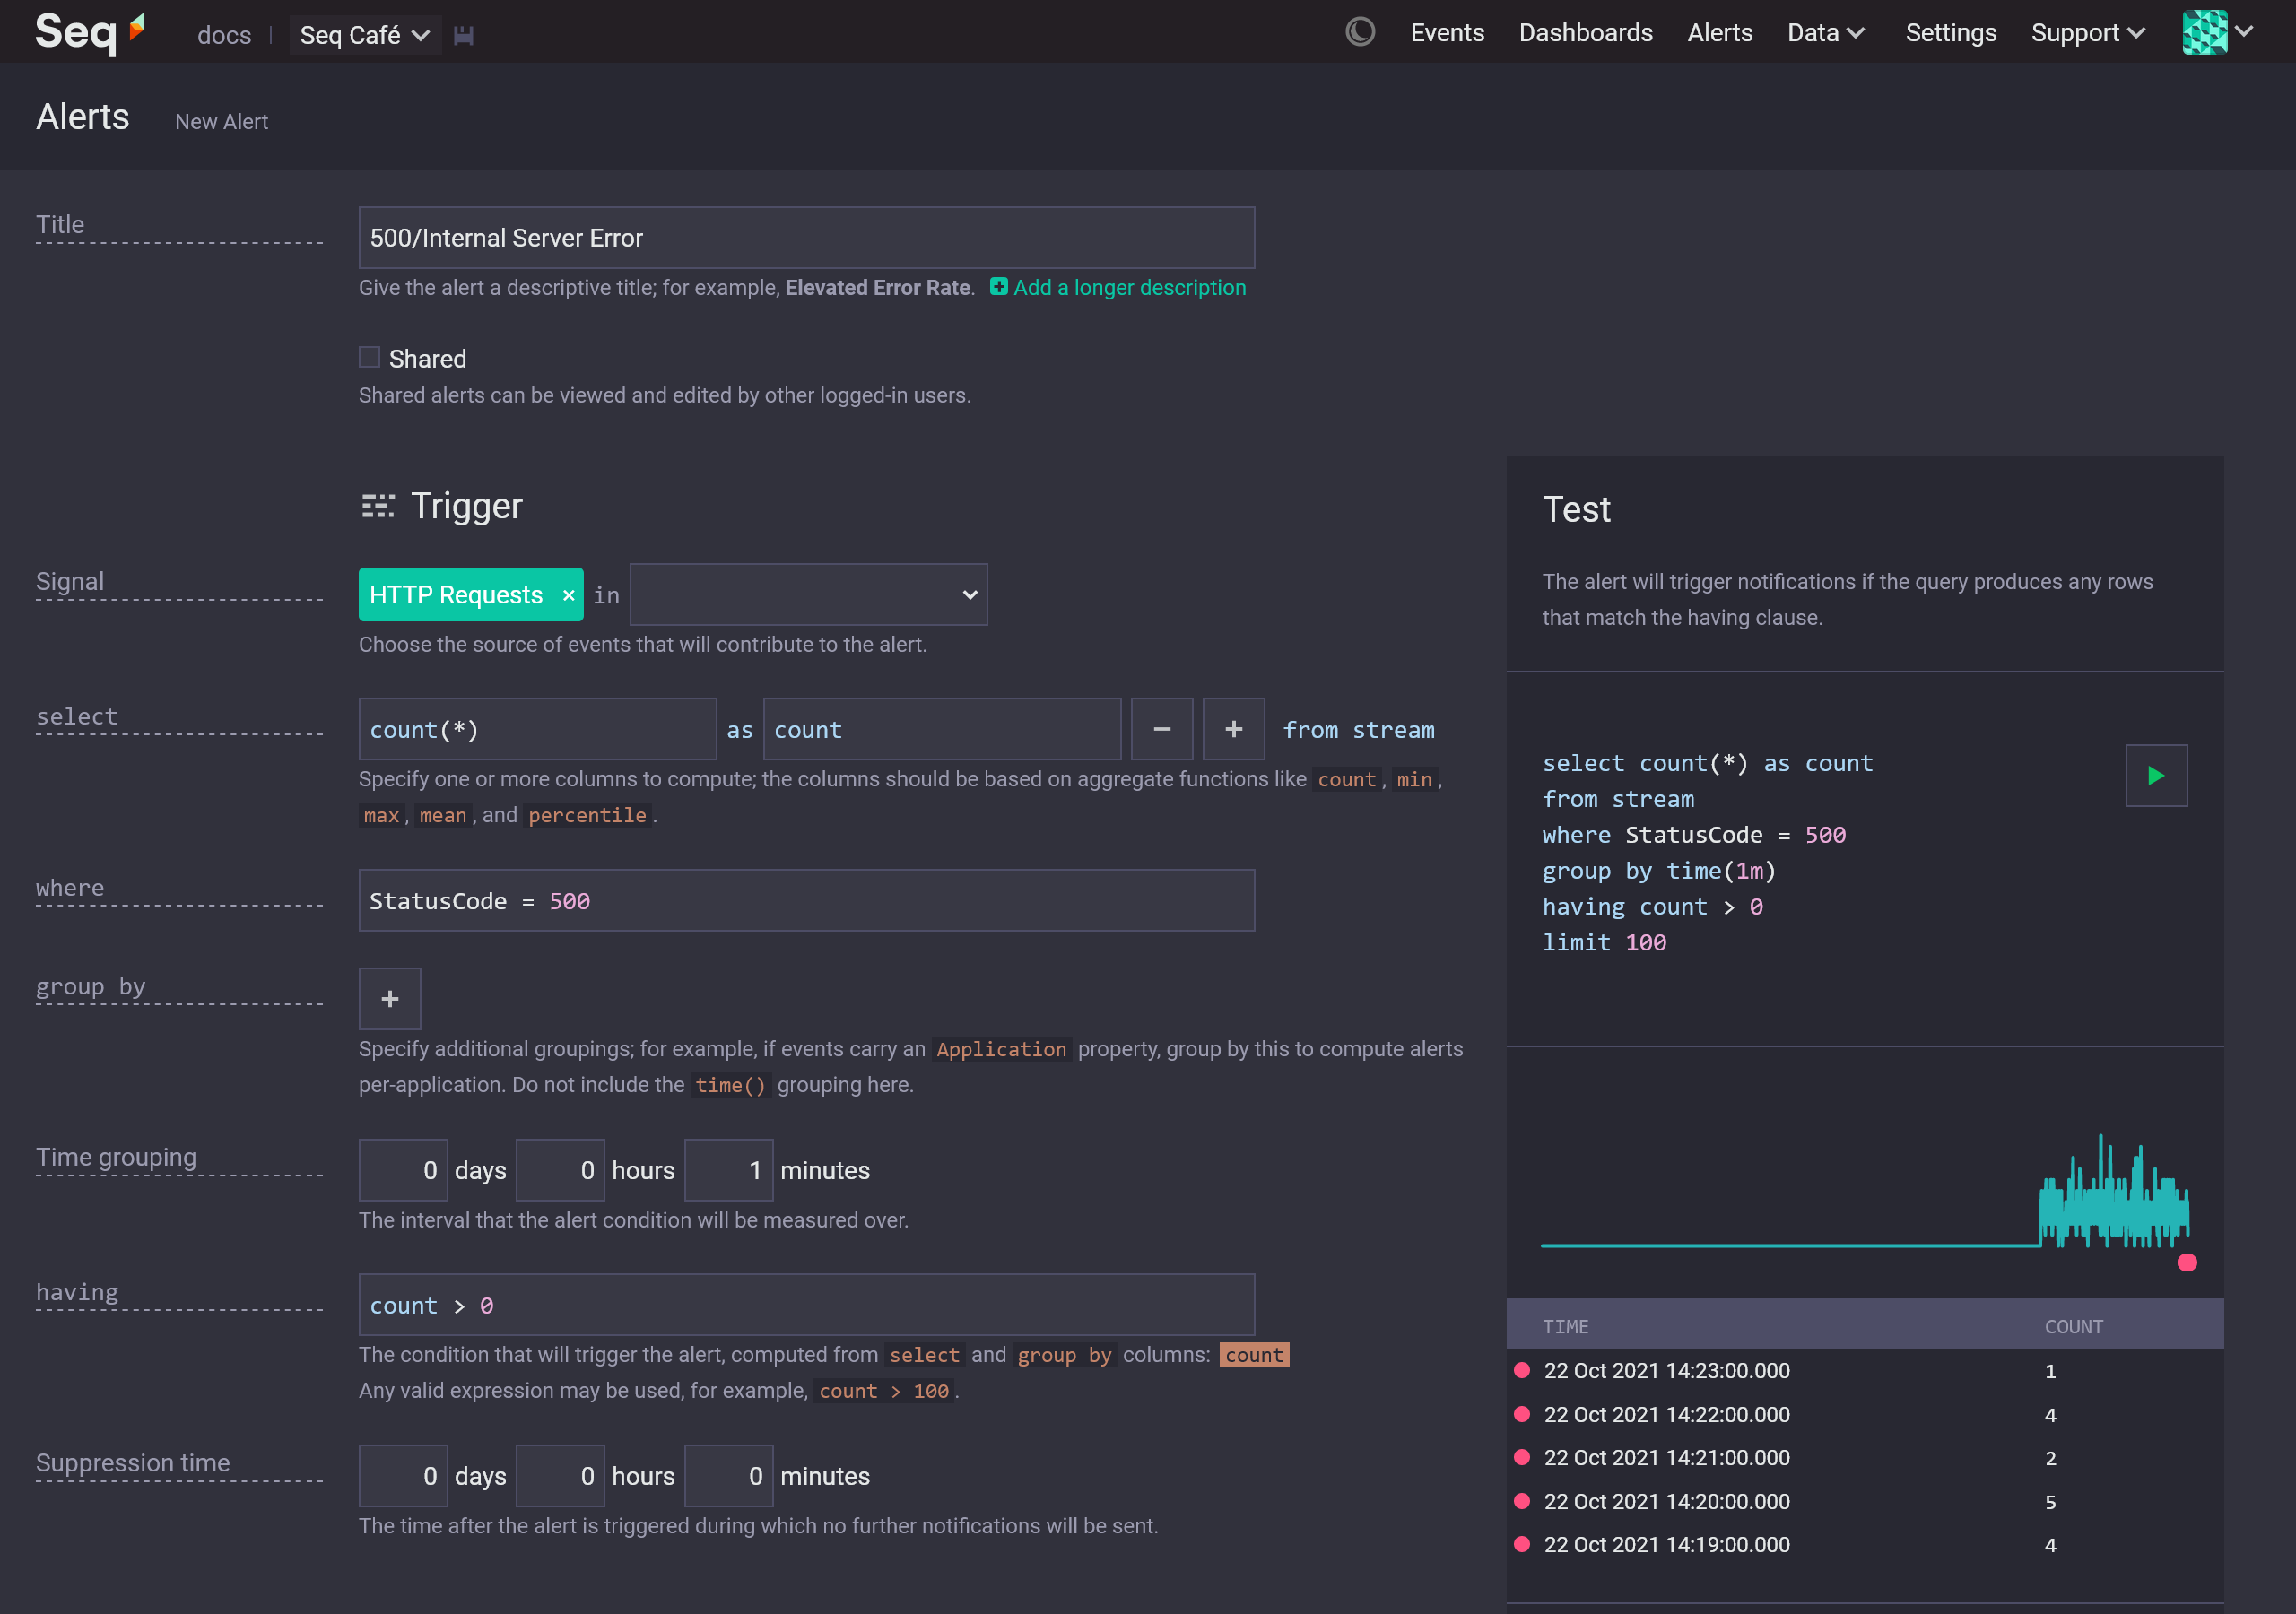
Result of clicking Test on the Alert Editor.
The chart will show the result of running your alert query without the trigger condition (having clause); in our example, this means that the chart will show the count of error events occurring throughout the day.
Beneath the chart, rows that match the trigger condition will be displayed. These are the time ranges in the past day that would have triggered the alert.
Step 4: Add notifications
When this alert triggers, we'll send notifications by email. Assuming that you've configured an instance of the Seq.App.EmailPlus package, this is as simple as selecting it from the drop-down:
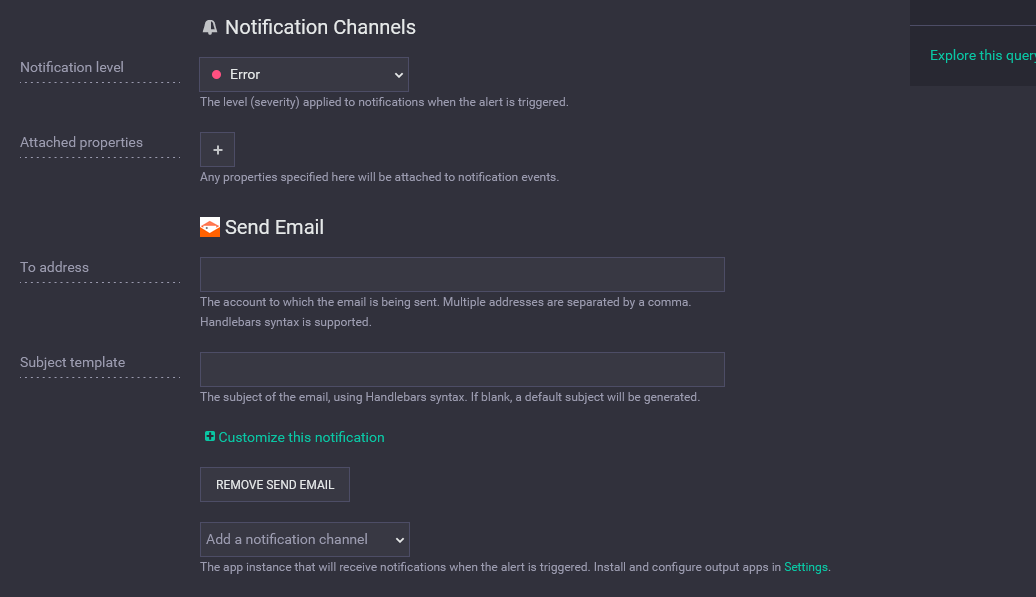
Notifications section, showing the Email app selected.
Our instance of the email app allows the to address to be overridden, so we'll set the address for notifications here. Additional properties can be added to notifications produced by the alert here too.
Because the individual errors are a useful piece of information to include in notifications, we'll click Customize this notification and Include contributing events:
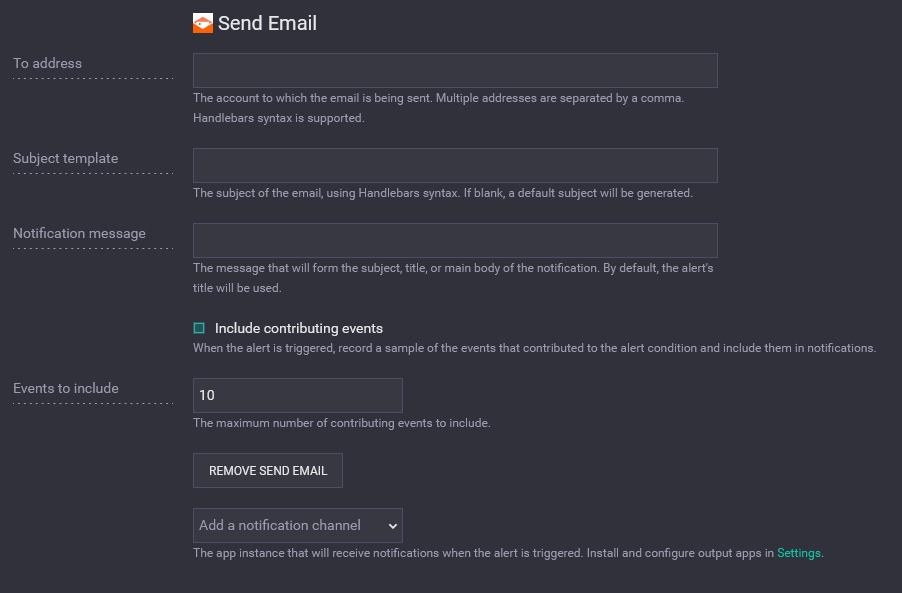
Email notification with Include contributing events checked.
The email notifications we receive will now include up to ten of the errors that triggered the alert.
Step 5: Save and monitor
Finally, saving the alert will add it to the Alerts screen.

New alert saved to the Alerts screen
Congratulations! You've just created your first alert.
Viewing alert status
The Alerts screen displays the status of all shared and personal alerts at a glance.
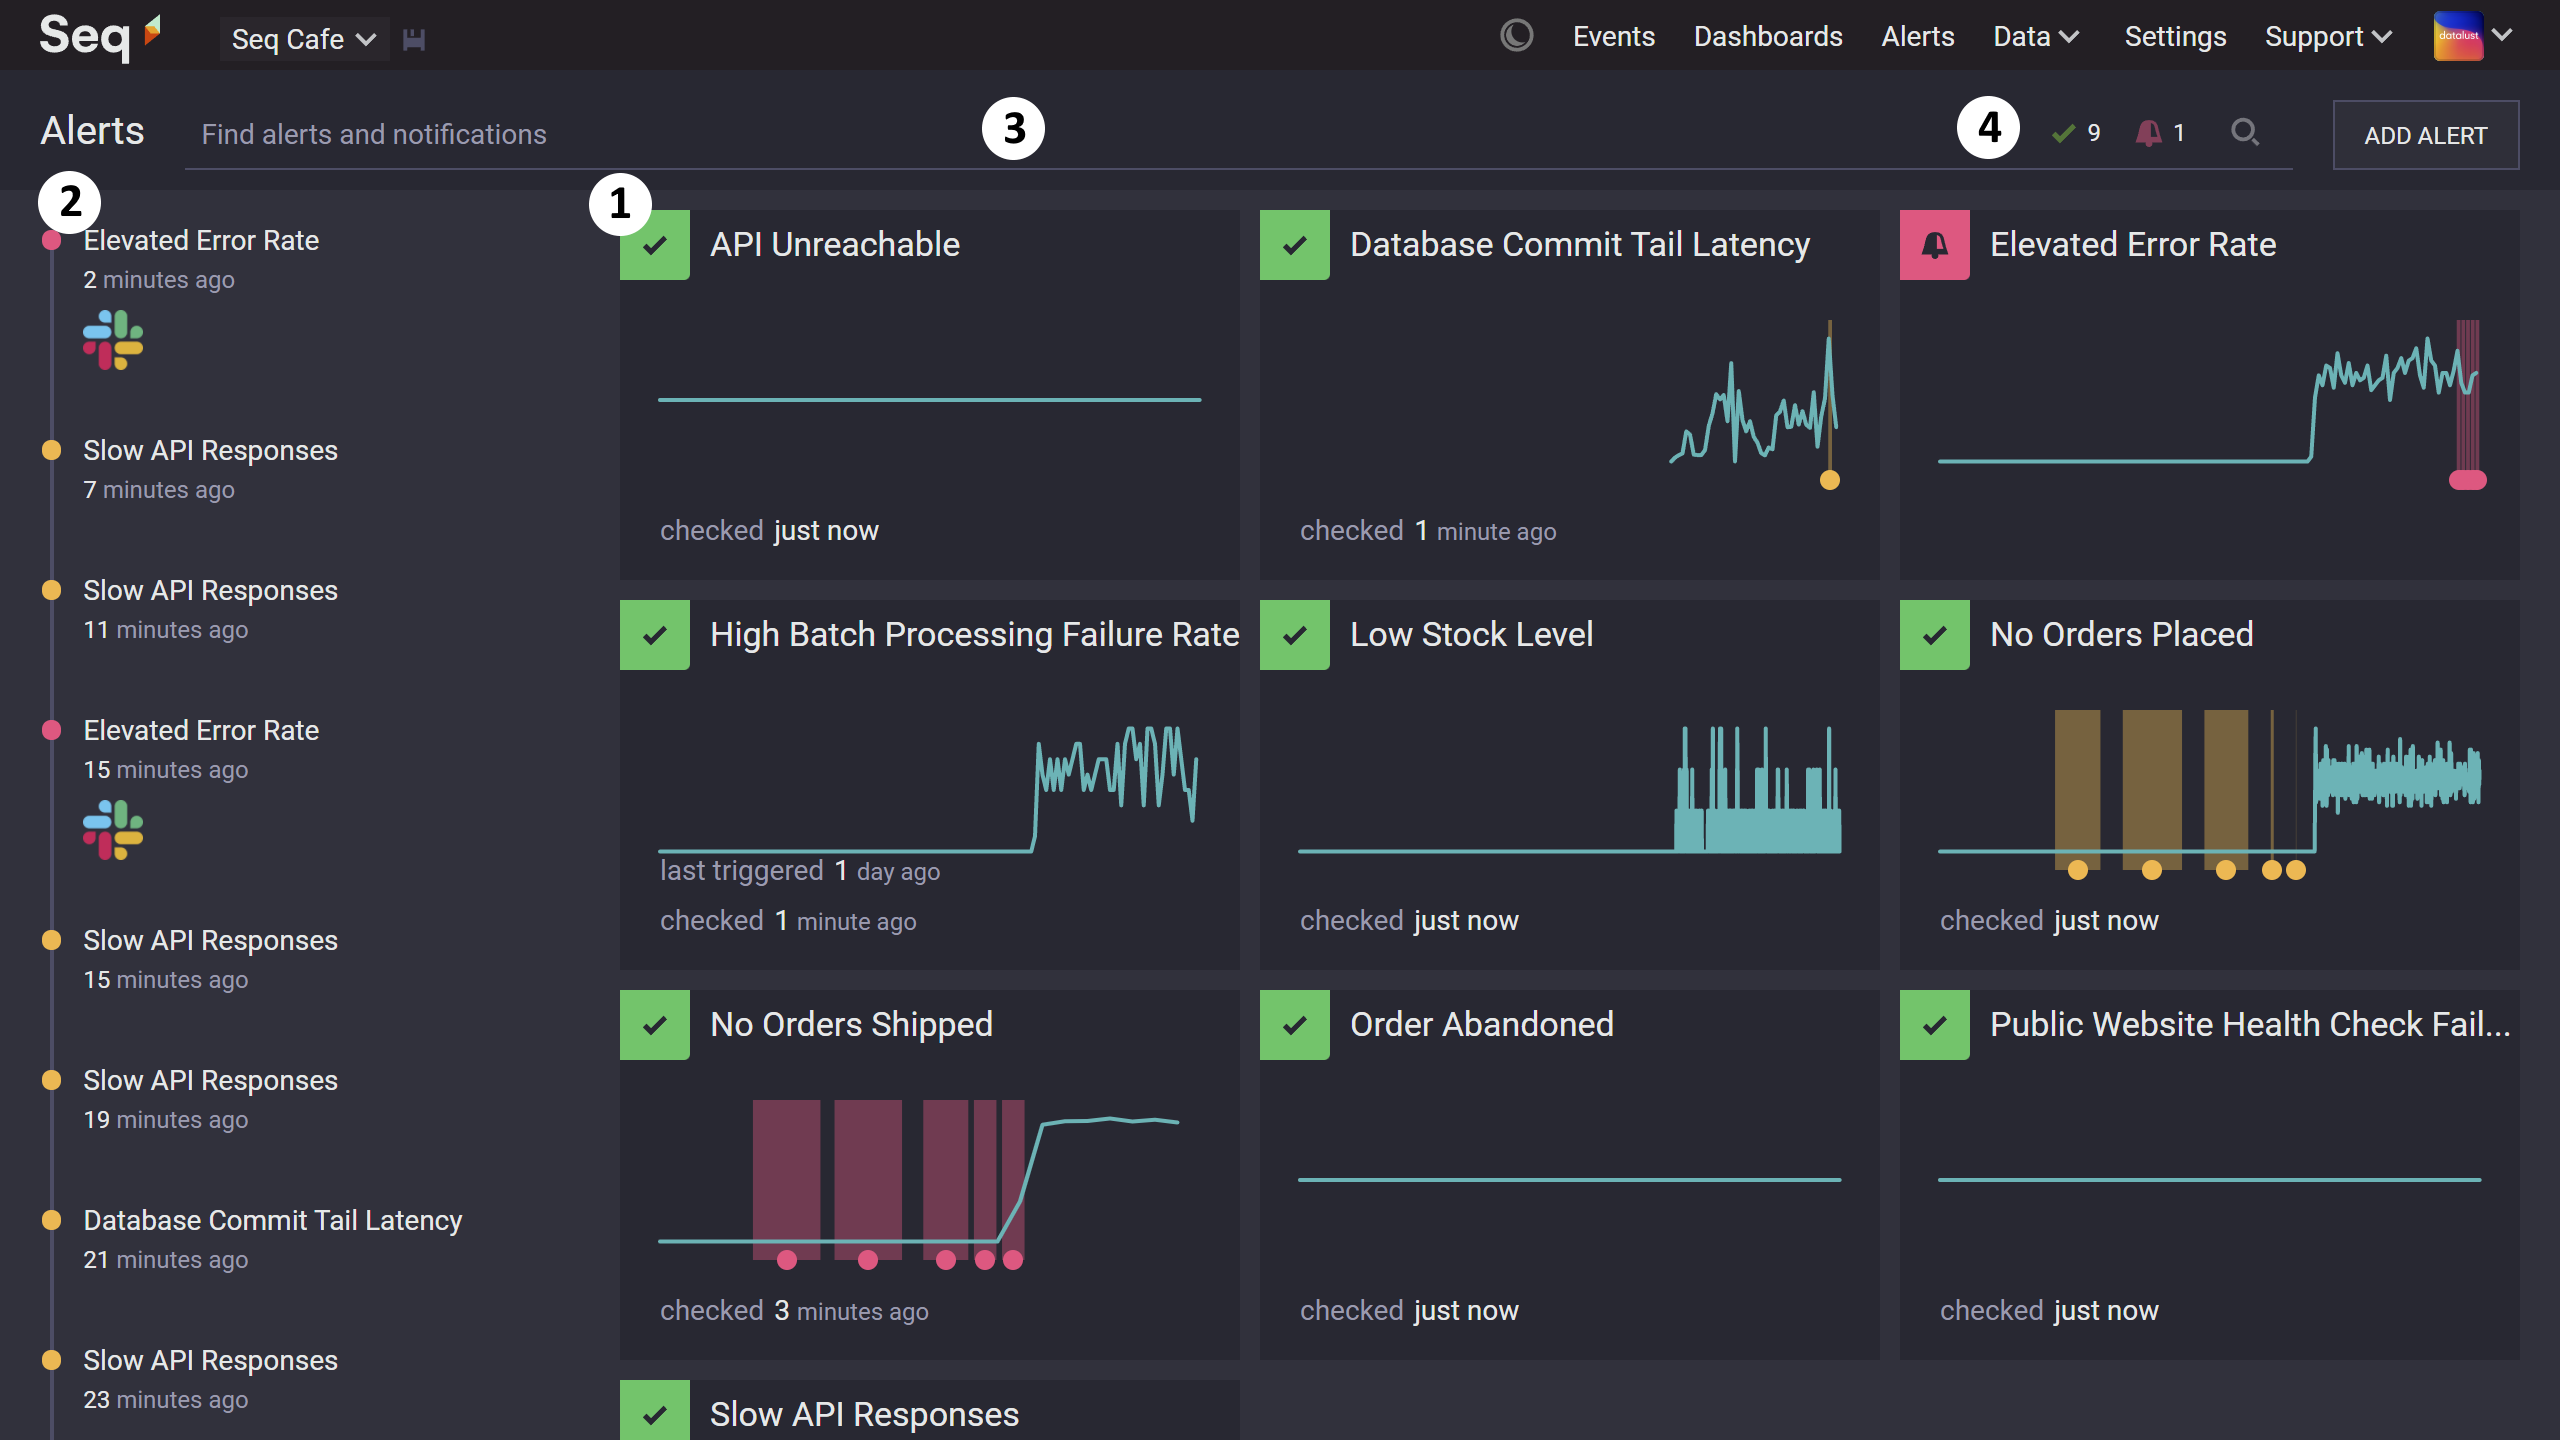
The Alerts screen.
The main elements of the screen are:
-
Alert summaries (1) — a card is shown for each alert. At the top left, a bell icon will be shown if the alert was triggered the last time it was checked, and a tick will be shown otherwise. Clicking on the alert title will open the Alert Editor.
-
Notification history (2) — the last five notifications for each alert, and a roll-up of past notification activity, is shown here.
-
Alert filter (3) — typing part of the alert title here will filter the alerts and notifications to those with matching titles.
-
Status filters (4) — selecting one of the alert status values here will filter the alerts and notifications to those with the corresponding status.
Suppressing nuisance alerts
Sometimes, an alert belonging to a Seq user might flood a public notification channel with unwanted messages.
Administrators can disable nuisance alerts in Settings > Notifications. All alerts, belonging to all users, will be shown here.
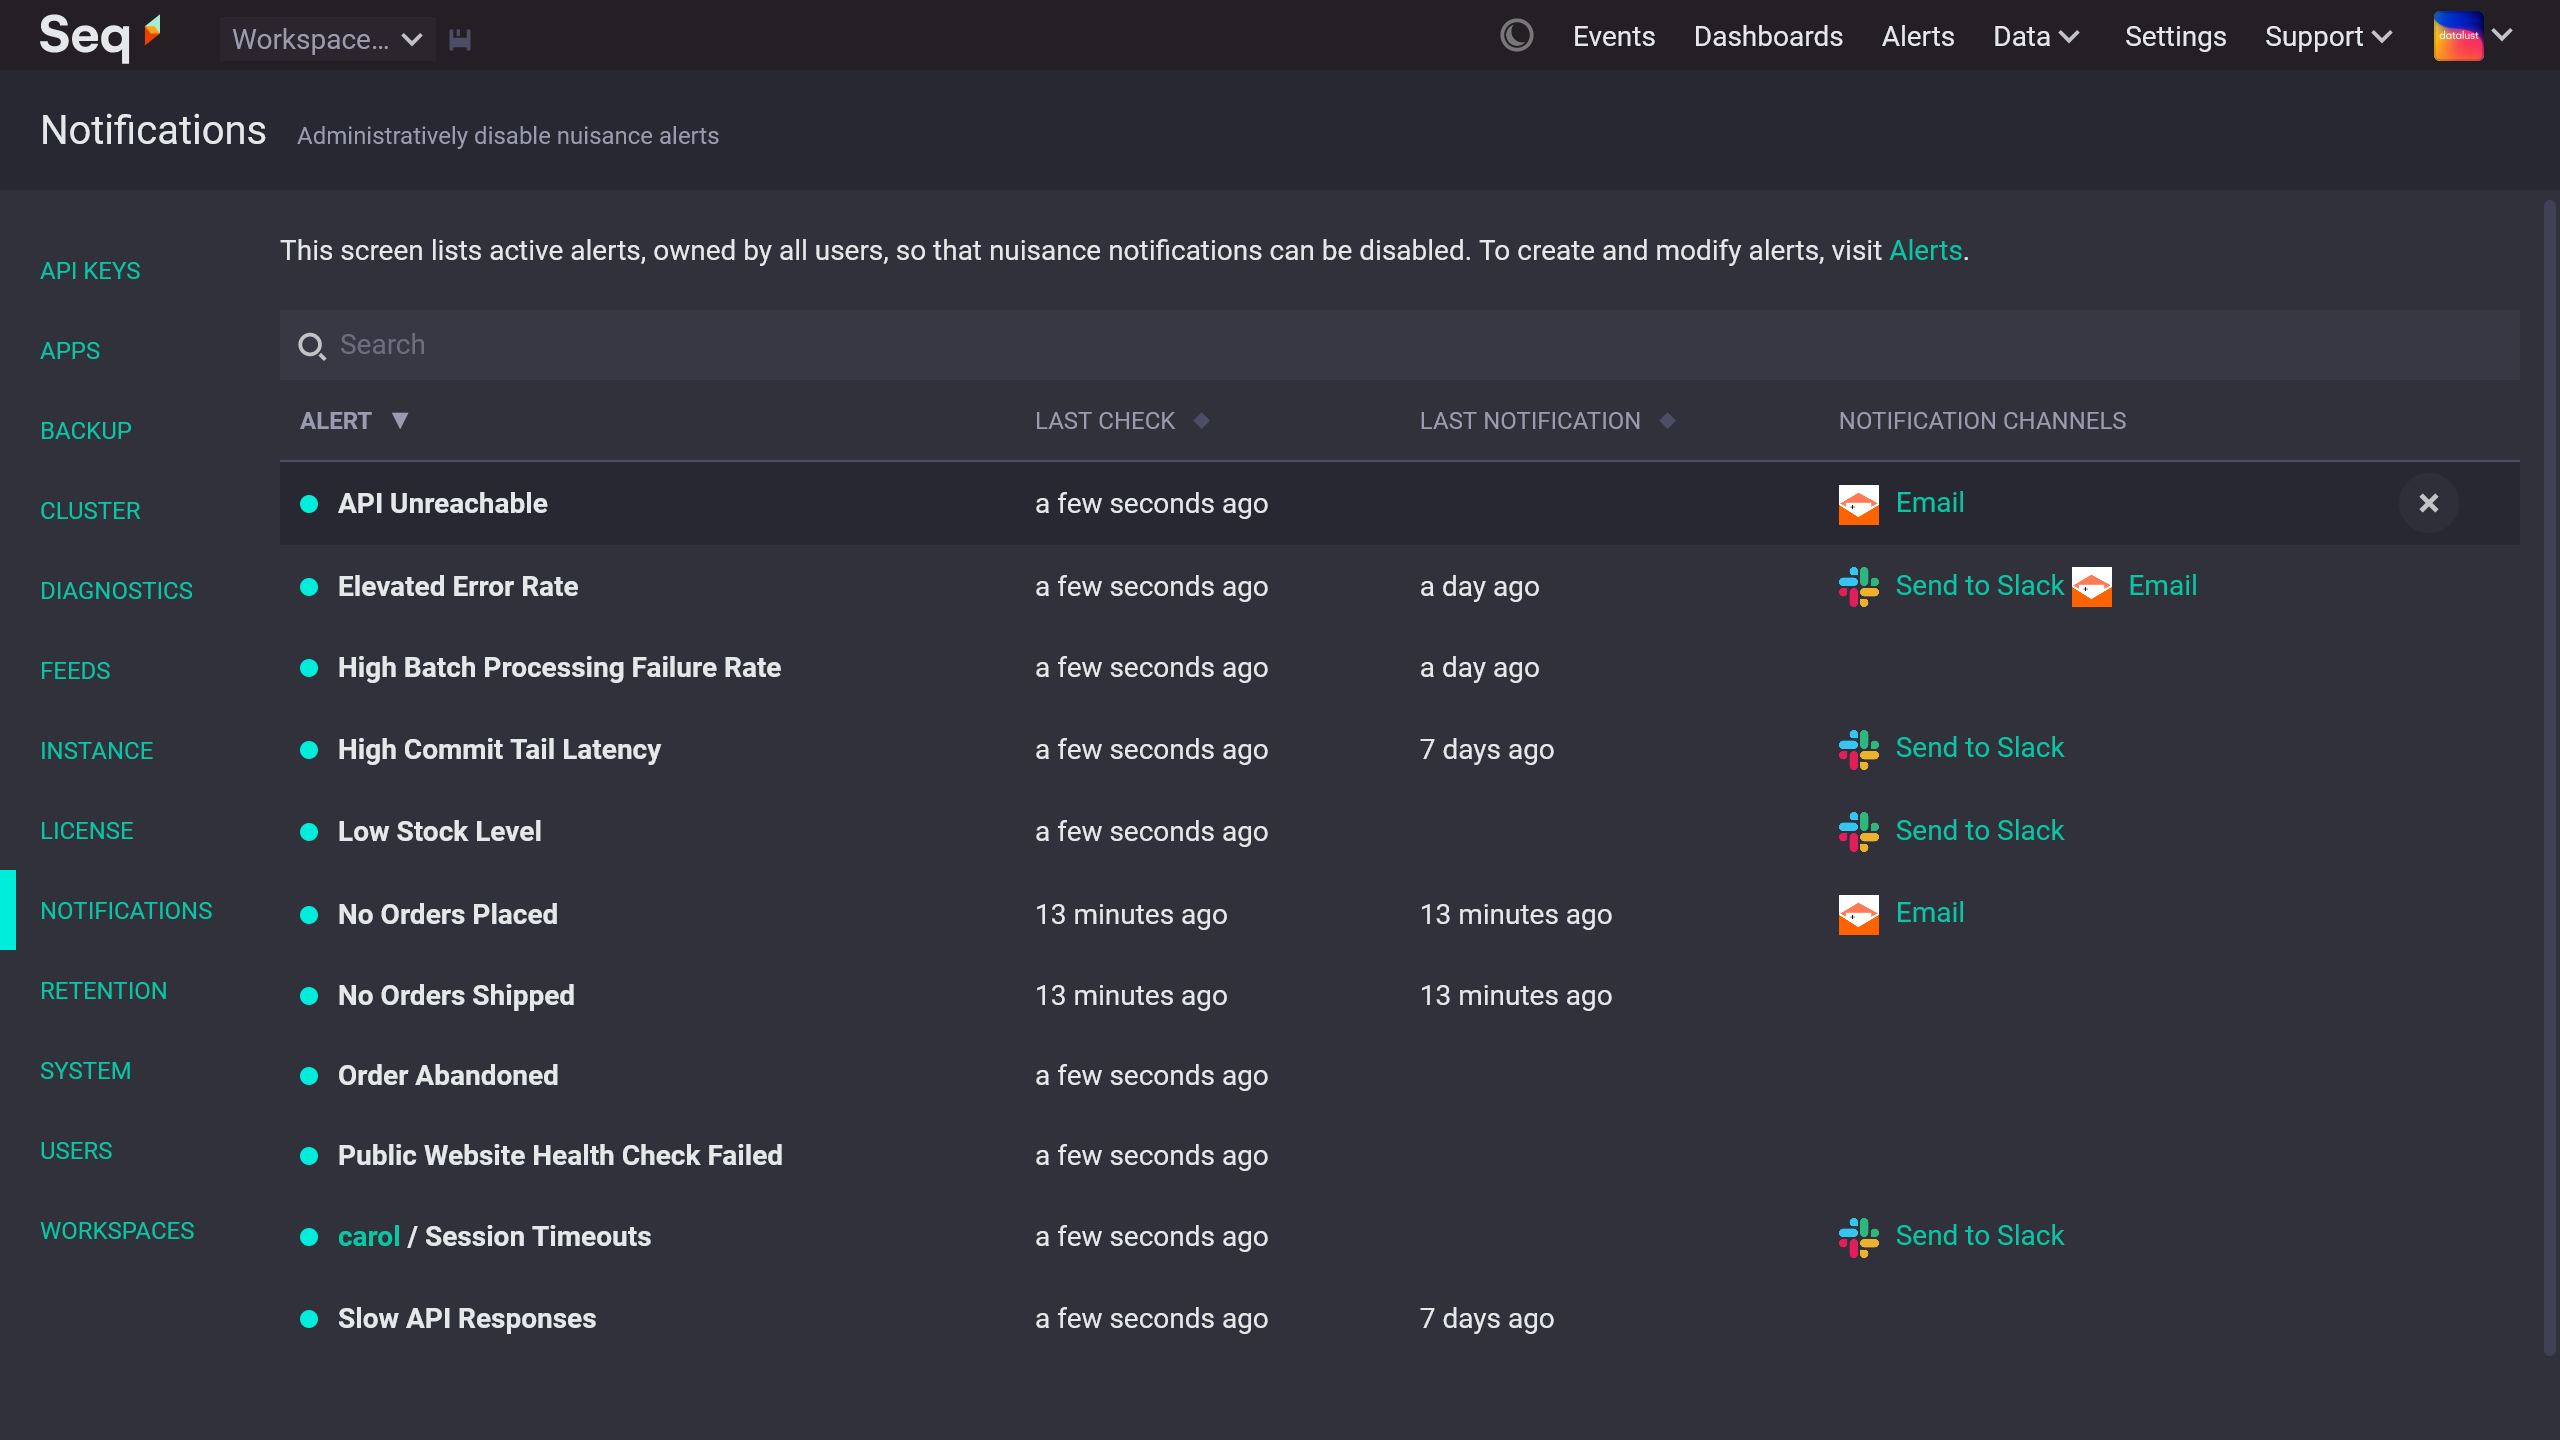
Settings > Notifications screen, showing active alerts.
Clicking the × icon beside an alert will silence that alert until the user next edits it.
Updated 8 months ago
